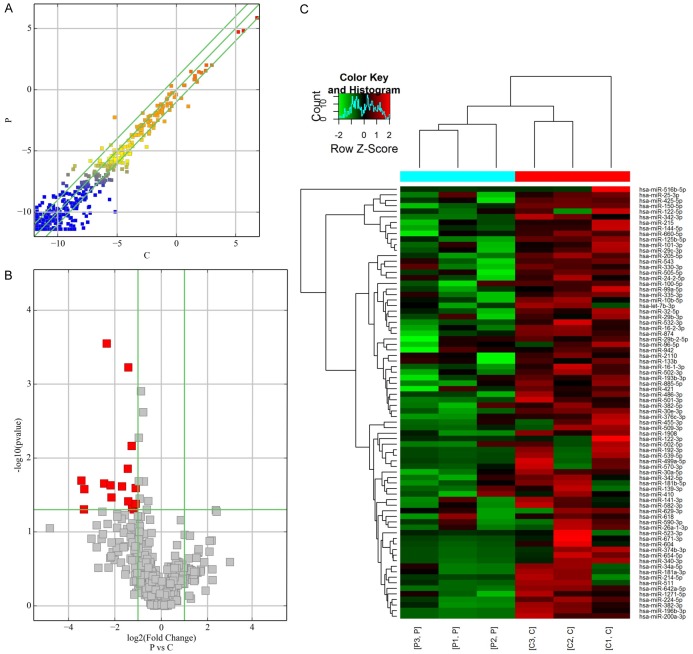
Figure 1.
miRNA profile of microarray data in the serum. A. Scatter-plot of miRNA expression. The miRNAs above the top green line and below the bottom green line indicate a more than 2.0-fold change between GC resistance and GC sensitive samples. B. Volcano plot of the differentially expressed miRNAs. The red points in the plot represent differentially expressed miRNAs with statistical significance. C. Hierarchical clustering shows a distinguishable miRNA expression profile between the two groups and homogeneity within groups. RNA was extracted from cartilage samples obtained from nine GC-resistant patients randomly divided into three groups (P: patient) and nine GC-sensitive patients similarly divided into three groups (C: control).

