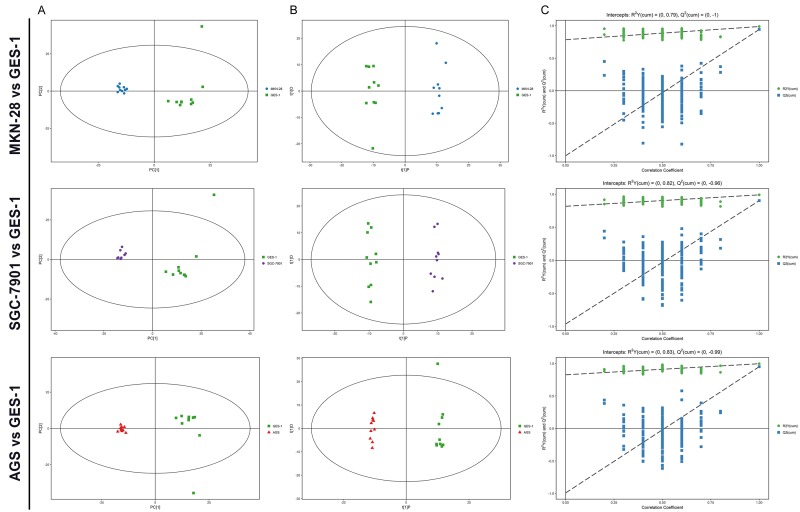
Figure 2.
Metabolic profiling between various differentiation grades of gastric cancer cells and normal controls. A. PCA score plots based on various differentiation grades of gastric cancer cells and normal controls. B. OPLS-DA scores plots based on various differentiation grades of gastric cancer cells and normal controls. C. Statistical validation of thecorresponding OPLS-DA models using permutation analysis (200 times).

