
Figure 1.
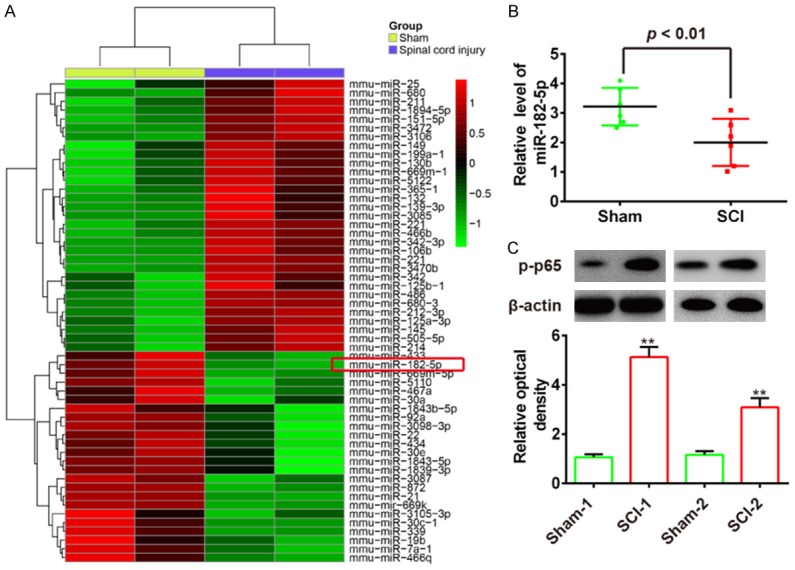
miR-182-5p is downregulated in rats after spinal cord injury (SCI). A. Heat map of miRNA profiles represented the significantly regulated miRNAs. The color code in the heat maps is linear with green as the lowest and red as the highest. miRNAs that were upregulated are shown in green to red, whereas miRNAs that were downregulated are shown from red to green. B. miR-182-5p expression was validated by qRT-PCR in rats after SCI (n = 6). P < 0.01 vs. Sham group. C. Expression of p-p65 in SCI rats was measured by Western Blot. (n = 2). Data represents the mean ± SD of three independent experiments. **P < 0.01 vs. Sham group.