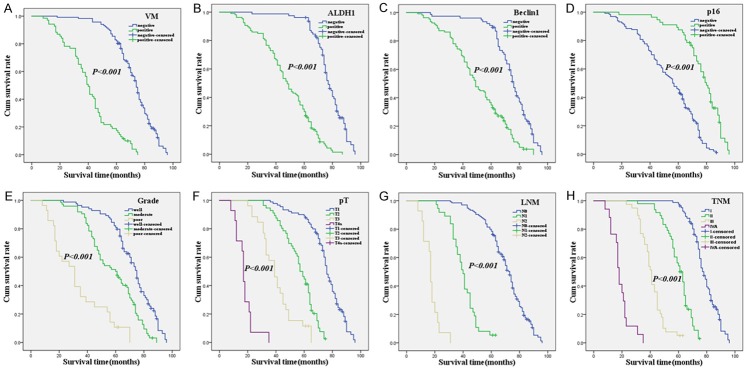
Figure 2.
Kaplan-Meier analysis of the survival rate of patients with OSCC. The y-axis represents the percentage of patients; the x-axis, their survival in months. (A) Overall survival of all patients in relation to VM (log-rank = 128.741, P<0.001); (B) Overall survival of all patients in relation to ALDH1 expression (log-rank = 106.036, P<0.001); (C) Overall survival of all patients in relation to Beclin1 expression (log-rank = 52.807, P<0.001); (D) Overall survival of all patients in relation to p16 expression (log-rank = 53.718, P<0.001); In (A-D) analyses, the green line represents patients with positive VM, or ALDH1, or Beclin1, or p16, and the blue line representing the negative VM, or ALDH1, or Beclin1, or p16 group. (E) OS of all patients in relation to tumor grade (log-rank = 97.222, P<0.001, the blue line represents patients with grade 1 group, the green line represents patients with grade 2 group, the brown line represents patients with grade 3 group). (F) OS of all patients in relation to primary tumor (log-rank = 369.471, P<0.001, the blue line represents patients with pT1 group, the green line represents patients with pT2 group, the brown line represents patients with pT3 group, the purple line represents patients with pT4a group). (G) OS of all patients in relation to LNM (log-rank = 383.472, P<0.001, the blue line represents patients with N0 group, the green line represents patients with N1 group, the brown line represents patients with N2 group). (H) OS of all patients in relation to TNM stage (log-rank = 434.913, P<0.001, the blue line represents patient with I stage group, the green line represents patients with II stage group, the brown line represents patients with III stage group, the purple line represents patients with IV A stage group).

