Figure 1.

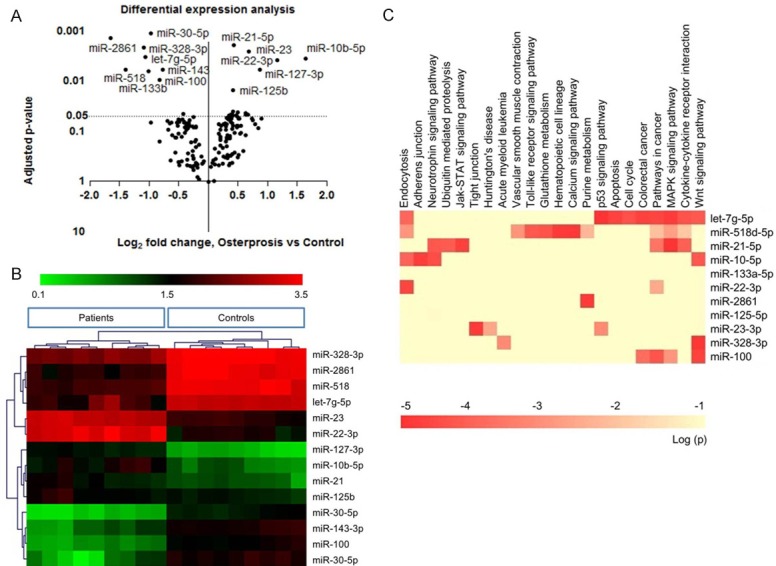
A: Volcanic chart showed aberrant expressed miRNAs among 150 tested circulating miRNAs. P value of paired t-test was used as y-axis, and Log2 (-2Δct) as x-axis. B: Real time PCR results showed down-regulated miRNAs in osteoporotic patient: let-7g-5p, miR-133b, miR-328-3p, miR-22-3p, miR-2861, miR518, and up-regulated miR-10b-5p, miR-21, miR-125b, miR-23 and miR-100. C: Clustering of these miRNAs correctly classify osteoporotic patients and healthy controls. Heatmap of KEGG pathways enriched from 14 miRNAs target genes was plotted. The 14 miRNAs were involved in multiple pathways, especially Wnt pathway, bone metabolic, cell growth and differentiation pathway.
