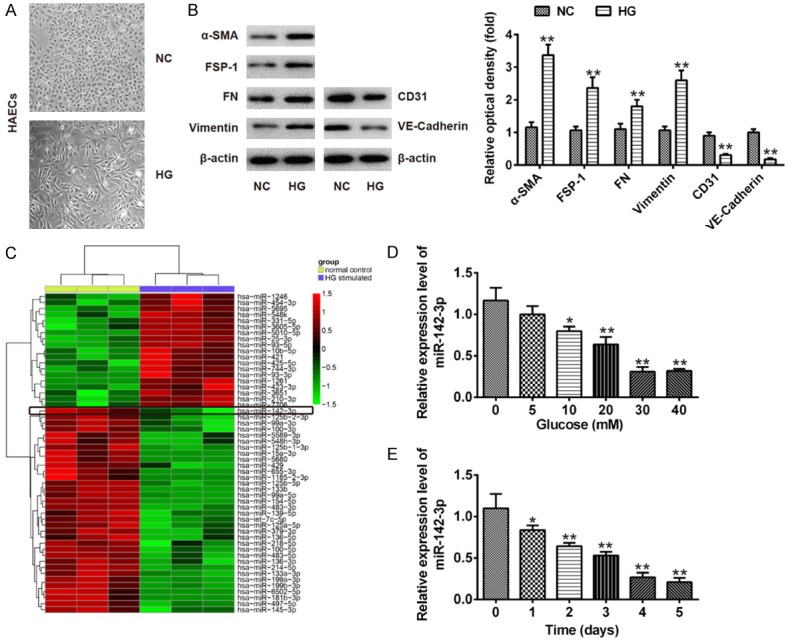
Figure 1.

miR-142-3p was involved in HG induced EndMT in HAECs. A. Morphological changes in HAECs after HG treatment. B. The protein expression of mesenchymal markers (α-SMA, FSP-1, vimentin, FN) and endothelial markers (CD31 and VE-cadherin) were determined by Western Blot. Data represent the mean ± SD of three independent experiments. **P < 0.01 vs. NC group. NC: 5 mmol/l glucose, HG: 30 mmol/l glucose. C. Heatmap of normalized expression levels of miRNAs in HAECs treated with/without HG. Green indicates low expression levels; red indicates high expression levels. D. qRT-PCR was performed to determine the expression levels of miR-142-3p in HAECs pre-treated for 5 days with 0, 10, 20, 30, or 40 mM HG. Data represent the mean ± SD of three independent experiments. *P < 0.05, **P < 0.01. E. qRT-PCR was performed to determine the expression levels of miR-142-3p in HAVECs pre-treated with 30 mM HG for 1, 2, 3, 4 or 5 days. Data represent the mean ± SD of three independent experiments. *P < 0.05, **P < 0.01.
