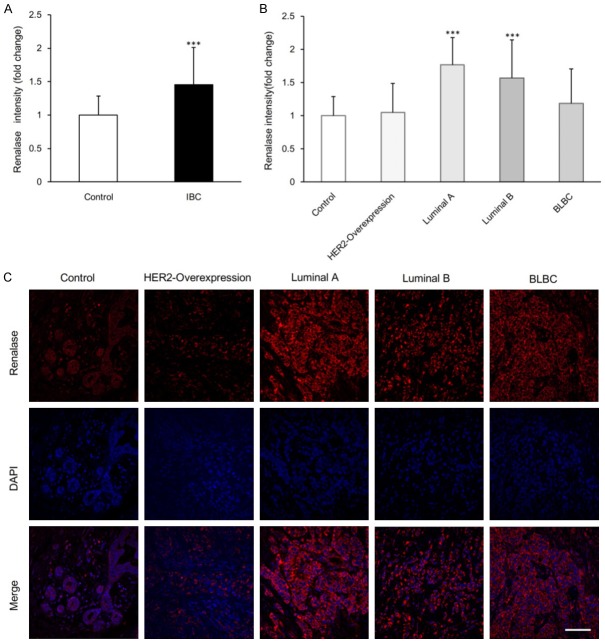
Figure 2.
Renalase expression in normal breast tissue and all subtypes of IBC tissue. A. Comparison of renalase fluorescence intensity in normal control group (n=25) and IBC group (n=58). Data are mean ± SD. ***P<0.001 when compared to control group. B. Comparison of renalase fluorescence intensity in normal control (n=25), HER2-Overexpression (n=9), luminal A (n=16), luminal B (n=20) and BLBC (n=13) group. Data are mean ± SD. ***P<0.001 when compared to control group. C. Representative confocal immunofluorescence images of renalase staining. Red, renalase staining. Blue, DAPI staining of the nucleus. Scale bar, 100 um.

