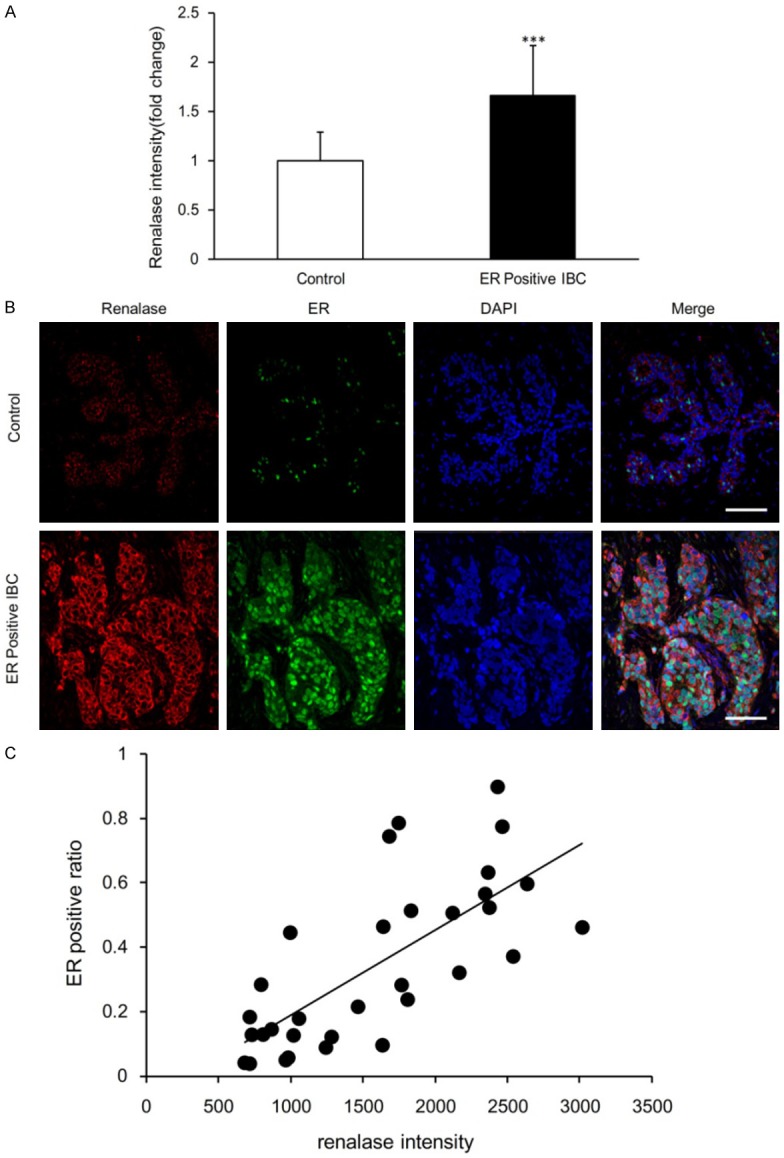
Figure 3.

Renalase expression in normal breast tissue and ER positive IBC tissue. A. Comparison of renalase fluorescence intensity in normal control group (n=25) and ER positive IBC group (n=36). Data are mean ± SD. ***P<0.001 when compared to control group. B. Co-immunostaining to show the localization of renalase (red) and ER (green). Blue, DAPI staining of the nucleus. Scale bar, 100 um. C. Correlation between renalase fluorescence intensity and ER positive ratio in normal control (n=15) and ER positive IBC (n=17) sections. The correlation coefficient (R) was 0.7246 and the statistical significance (P) less than 0.0001.
