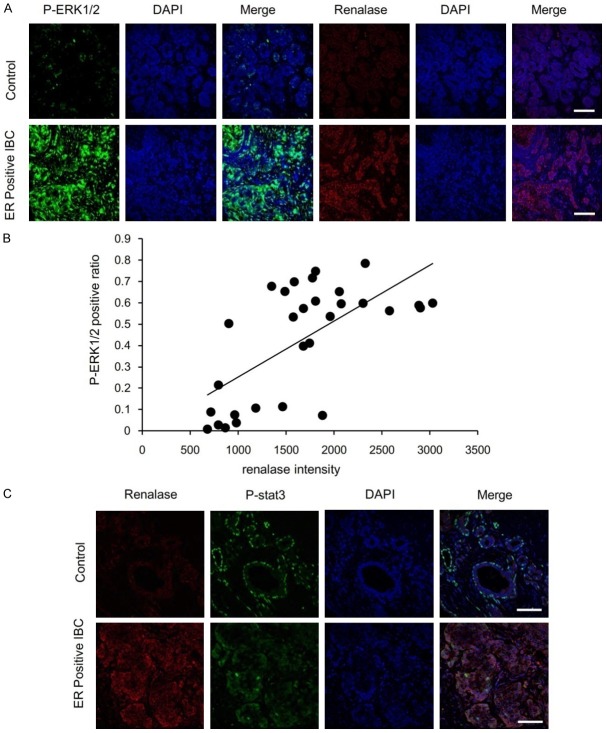
Figure 4.
The relation of renalase and p-ERK1/2 expression in ER-positive IBC. A. Colocalization of renalase with p-ERK1/2, as stained in serial tissue section images. Red for renalase staining, green for p-ERK1/2.Blue for DAPI staining of the nucleus. Scale bar, 100 um. B. Correlation between renalase fluorescence intensity and p-ERK1/2 positive ratio in normal control (n=11) and ER positive IBC (n=19) sections. R=0.6599, P<0.0001. C. P-STAT3 (green) and renalase (red) expression in control and ER-positive IBC. p-STAT3 was expressed in the normal breast tissue of the epithelial and myoepithelial cells, in the myoepithelial cells it was expressed in the nuclei of the cells. The positive expression rate of p-STAT3 in ER positive breast cancer was low. p-STAT3 was expressed in the cytoplasm and the nucleus of tumor cells. Blue, DAPI staining of the nucleus. Scale bar, 100 um.

