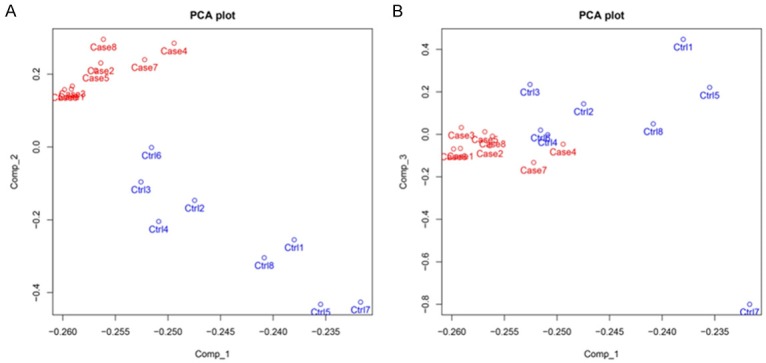
Figure 1.

The principal component analysis (PCA) plot. The Principal Components Analysis (PCA) plot showed that in comp_2 axe (A), AR patients can be distinguished from controls via miRNA profiles, whiledifferences of miRNA expressionbetween AR patients and controls were not found in comp_1 axe (A) as well as comp_3 axe (B). The PCA plot analysis of the 8 pairs of samples in microarray was used to distinguish AR patients and controls (Comp_1, Comp_2 and Comp_3 stand for three principal components respectively).
