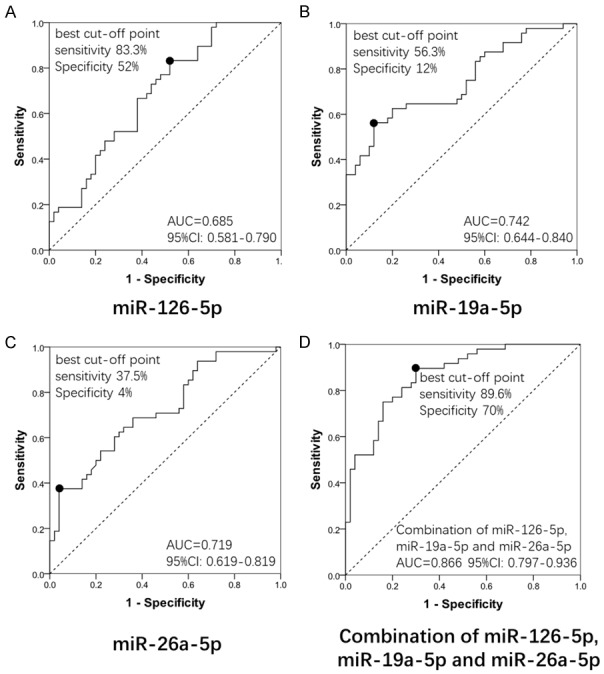
Figure 4.

ROC curve analysis of 3 DEMs in AR patients. ROC curve analysis was performed to evaluate the diagnostic value of the independent predicting miRNAs for AR risk in the multivariate logistic models in AR patients. A. The area under curve (AUC) of miR-126-5p was 0.685 (95% CI: 0.581-0.790); B. The AUC of miR-19a-5p was 0.742 (95% CI: 0.644-0.840); C. miR-26a-5p was 0.719 (95% CI: 0.619-0.819); D. The AUC of combination of miR-126-5p, miR-19a-5p and miR-26a-5p was 0.866 (95% CI: 0.797-0.936) with good sensitivity and specificity (89.6% and 70%, respectively) at the best cut-off point.
