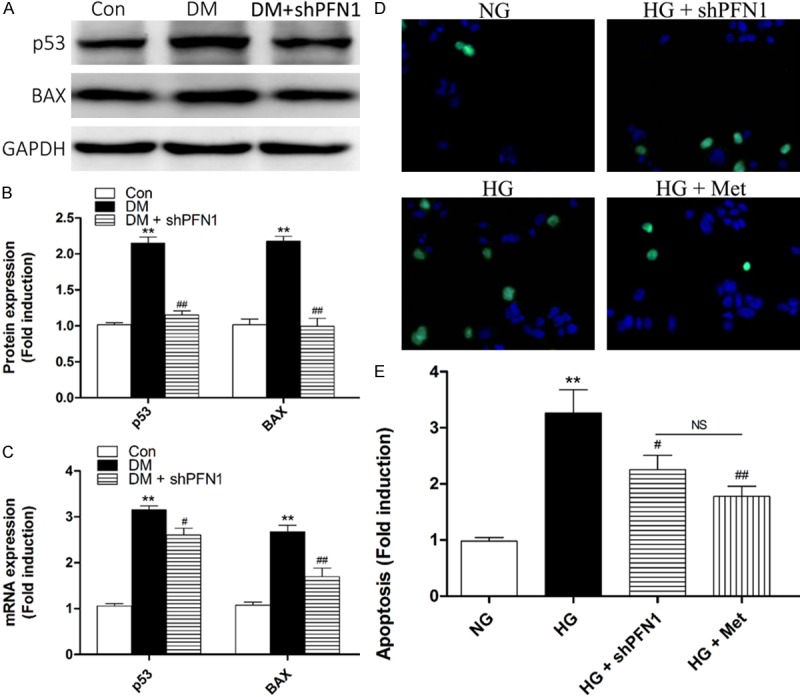
Figure 4.

Profilin-1 (PFN1) modulates apoptosis under HG conditions in vivo and in vitro. (A-C) Western blotting (A) and quantification (B) of p53 and BAX protein or real-time RT-PCR analysis of mRNA (C) expression profiles in control rats (Con), diabetic rats (DM), and DM plus shPFN1 (DM + shPFN1). **P<0.01 vs. Con; #P<0.05 vs. DM; ##P<0.01 vs. DM. (D-F) Fluorescence microscope (D) and quantification analysis (E) of cellular apoptosis levels by TUNEL in the following cell treatment groups: NG, HG, HG plus shPFN1 (HG + shPFN1), and HG plus metformin (HG + Met). **P<0.01 vs. NG; #P<0.05vs. HG; ##P<0.01 vs. HG; NS means not significant (P>0.05). Means ± SD. n=3.
