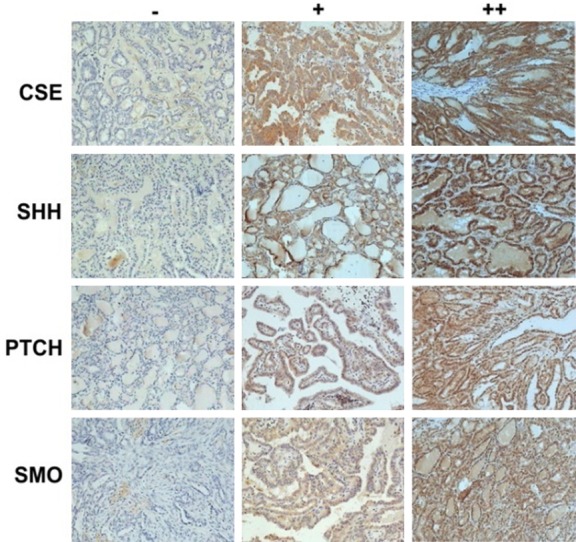
Figure 1.

Immunohistochemical staining of CSE, SHH, PTCH, and SMO. The expression levels of CSE and three Hh signaling molecules in PTC tissues were analyzed by IHC staining performed using specific antibodies against PTC. The expression profiles of CSE and three Hh signaling molecules in PTC tissues were graded as “-” (negative), “+” (moderate), or “++” (strong) (×400).
