Figure 4.

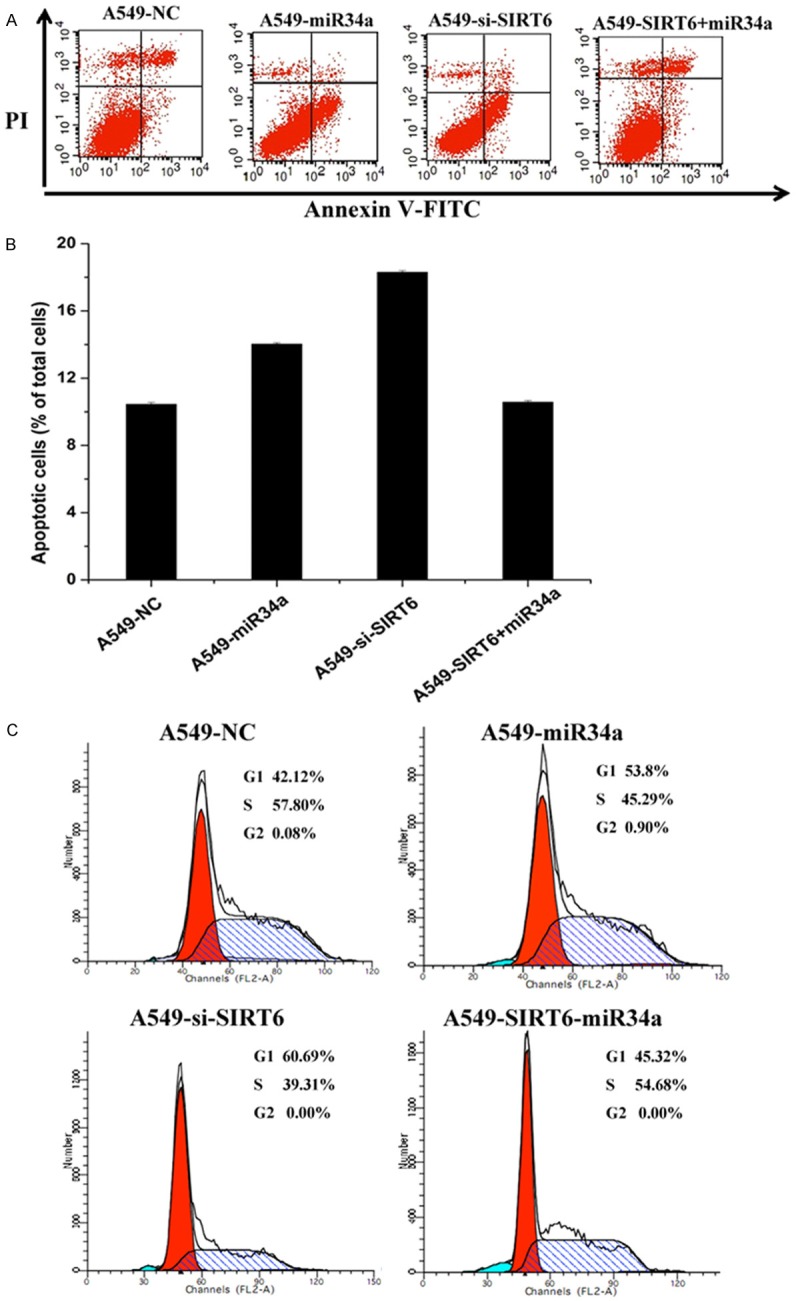
Apoptotic analysis of A549 cells transfected with different vectors. The data are presented as the mean ± SEM. A. Cells were stained with Annexin V-FITC/PI and analyzed by flow cytometry to determine the population of cells at the early a late apoptosis in the different treatment groups: A549 cells transfected with negative control mimic-treated (control), miR-34a, si-SIRT6 and SIRT6+miR-34a. B. The percentage of apoptotic cells in each group relative to the cells was used to evaluate the apoptotic rates. C. Cell cycle profile changes of A549 cells transfected with different vectors were assessed by flow cytometry using PI staining to measure the DNA content. The data are presented as the average of triplicated values.
