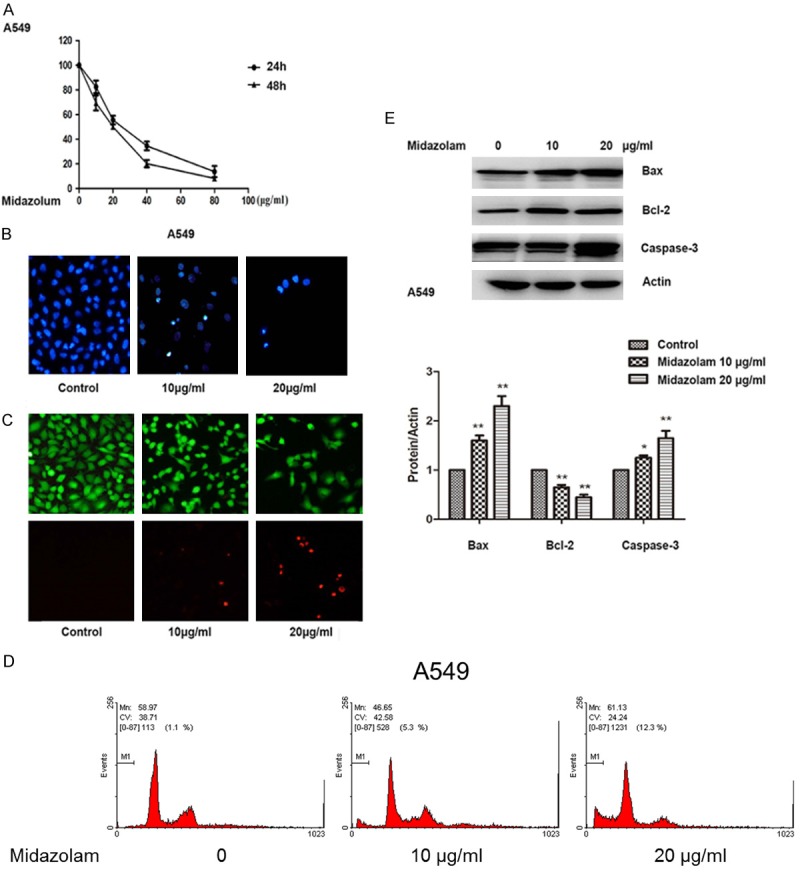
Figure 1.

Induction of apoptosis in A549 cells with midazolam. A: Cell viability of A549 cells treated with different concentrations of midazolam for 24 h or 48 h detected by MTT assay. B: Detection of the mode of cell death by DAPI staining assay. C: LIVE/DEAD staining assay of A549 cells following treatment with midazolam at varying concentrations. D: Flow cytometry analysis of A549 cells following treatment with midazolam at varying concentrations. E: Relative expression levels of Bcl-2, Bax, and caspase 3 following treatment with midazolam at varying concentrations for 48 h. Cells were observed using a microscope (original magnification ×20). *; P<0.05, **; P<0.01 compared with control.
