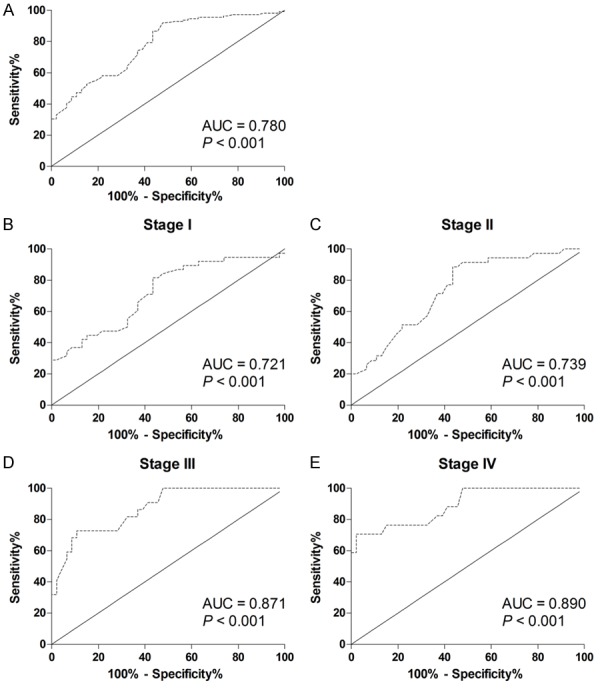
Figure 3.

Evaluation of hsa_circ_0007534 for CRC detection. Receiver operating characteristics (ROC) curves were drawn with the data of plasma hsa_circ_0007534 levels from 112 CRC patients and 46 healthy controls (A). ROC curves were drawn based on stage I patients and 46 healthy controls (B). ROC curves were drawn based on stage II patients and 46 healthy controls (C). ROC curves were drawn based on stage III patients and 46 healthy controls (D). ROC curves were drawn based on stage IV patients and 46 healthy controls (E).
