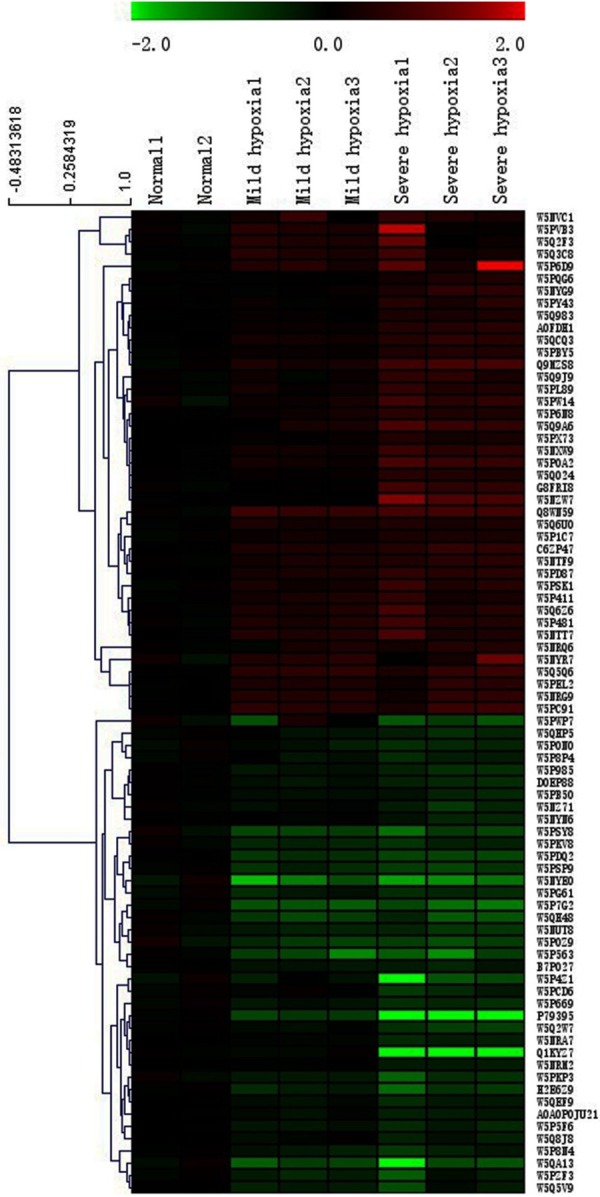
Figure 3.

Hierarchical clustering analysis of eighty differentially expressed proteins. The identity of each protein can be found in Table S3. Each column represents an experimental condition, each row represents a gene, red indicates up-regulation, and green indicates down-regulation. Means are average values of the three independent replicates. NOTE: The genes in bold font met the following criterion: Severe/Normal > 1.3 or < 0.77, meanwhile, Severe/Mild > 1.0 or < 1.0.
