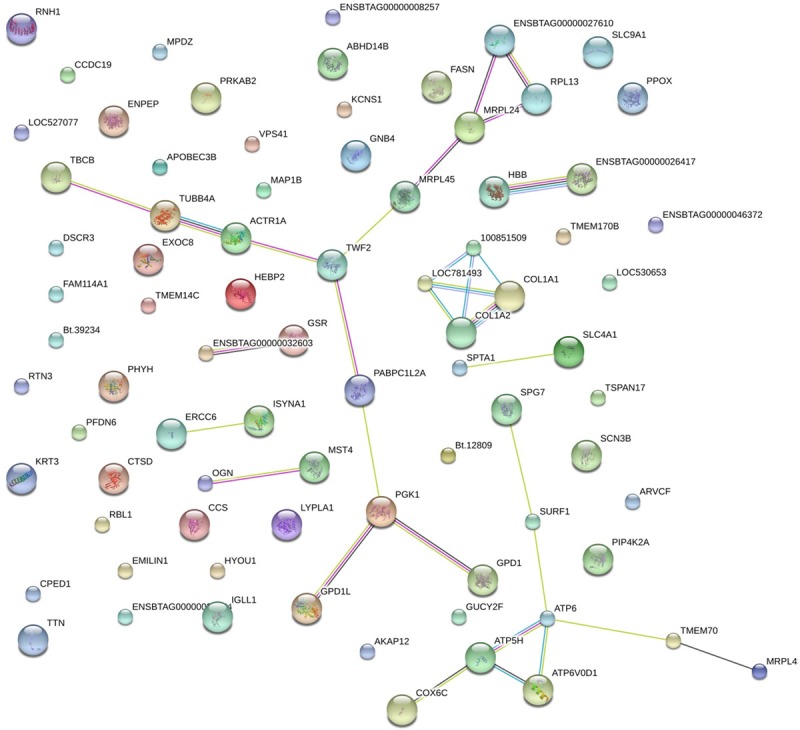
Figure 5.

Protein-protein interaction network analysis of eighty gradient differential proteins. The interaction network as analyzed using the Pathway Studio software. In this network, nodes represent proteins, lines represent functional associations between proteins. Notes: red lines, the presence of fusion evidence; the green line, the neighborhood evidence; the blue line, the co-occurrence evidence; the purple line, the experimental evidence; the yellow line, text mining.
