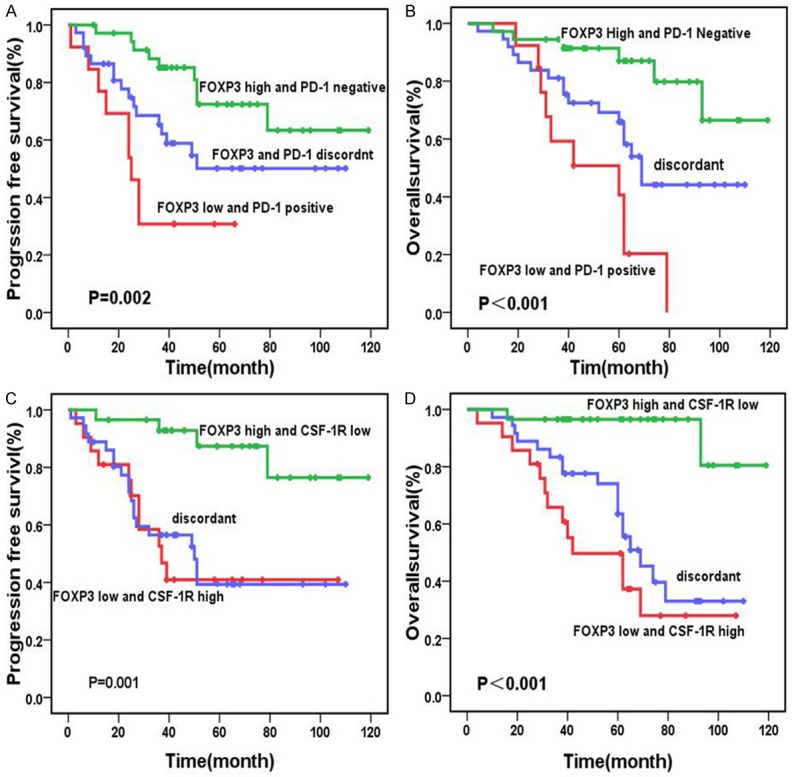
Figure 5.

Comparison of survival rates according to FOXP3/PD-1 and FOXP3/CSF-1R expression: Patients with a low number of FOXP3-positive cells and PD-1 positive cells showed significantly worse overall survival than patients with other expression patterns (P<0.001) (A). Patients with a high number of FOXP3-positive and PD-1 negative cells manifested significantly better progression-free survival than those with other expression patterns (P=0.002) (B). Patients with a low number of FOXP3-positive cells and high number of CSF-1R showed significantly worse overall survival than patients with the other expression patterns (P<0.001) (C). Patients with a high number of FOXP3-positive and low number of CSF-1R manifested significantly better progression-free survival than those with the other expression patterns (P=0.001) (D).
