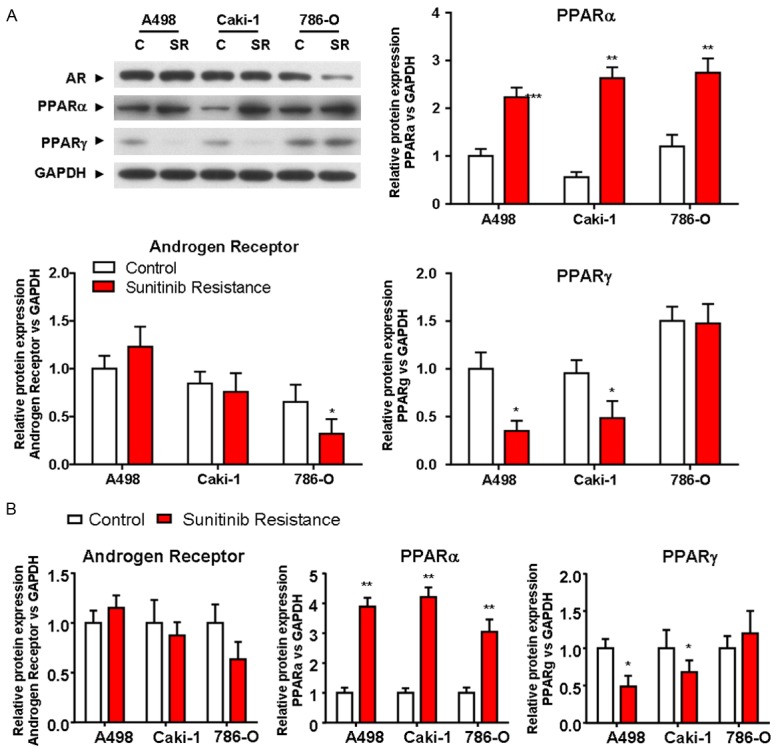
Figure 1.

Expressions of AR, PPARα and PPARγ in response to sunitinib resistance in ccRCC lines. Western blotting analysis (A) and RT-PCR (B) were used to examine the expressions of AR, PPARα and PPARγ at the protein and mRNA levels in sunitinib-resistant or parental cells (A498, CaKi-1 and 786-O). GAPDH was used as loading control. Data were expressed as the mean ± S.D. P < 0.05 versus control; Students’ t-test. All experiments were performed in triplicate independently. *P < 0.05, **P < 0.01. C, control; SR, sunitinib resistant.
