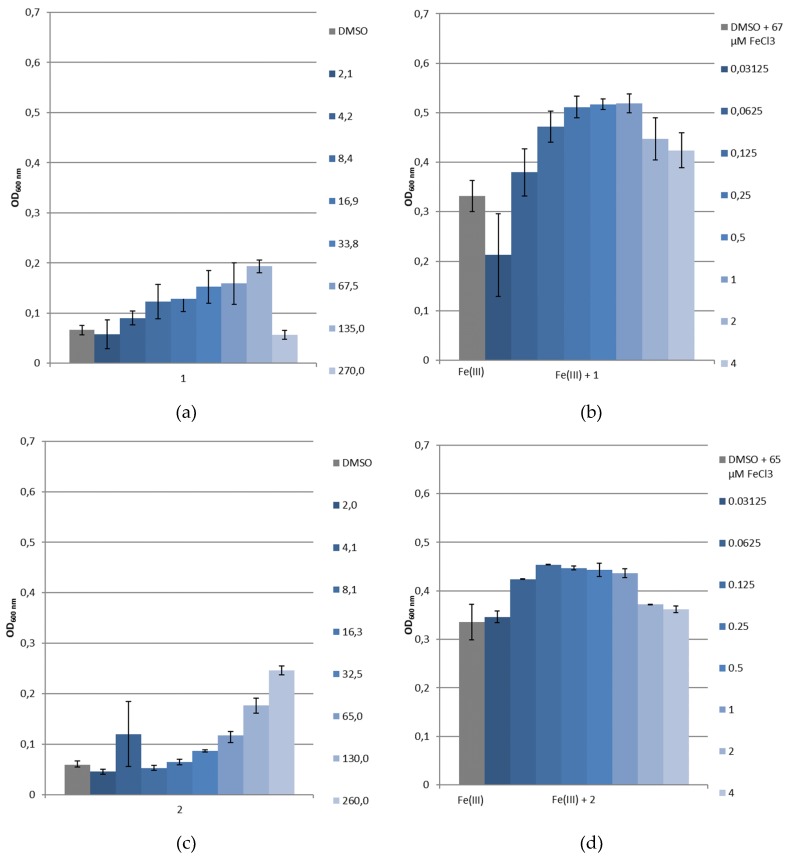
Figure 12.
Growth of P. aeruginosa PAO1 in SMM (a) without ferric iron and with 1, (b) with ferric iron and with 1, (c) without ferric iron and with 2 or (d) with ferric iron and with 2. Values given in the caption at the right of the histograms indicate for (a,c) the [L] concentration in μM and for (b,d) the [L]/[Fe(III)] molecular ratios.

