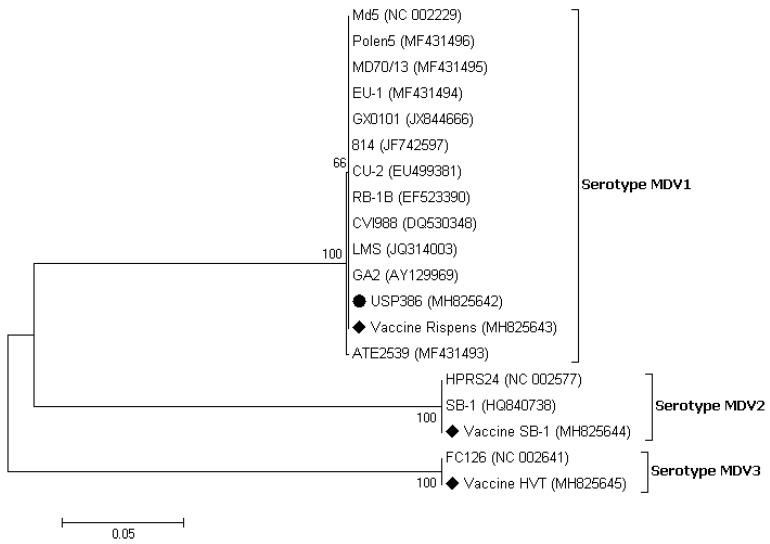
Figure 3.
Phylogenetic analysis of the nucleotide sequences of the MDV strains based on the partial gB gene. The strain names and GenBank accession numbers are shown. The black circle represents the field MDV strain used in this study. The black rhombus represents the MDV vaccinal control strains. The phylogenetic tree was constructed in MEGA v7.0 using the Neighbor-Joining method with 1000 bootstrap replicates. The evolutionary distances were computed using the Kimura 2-parameter model (K2 + G + I), and the scale bar represents the number of base substitutions per site.

