Figure 1.
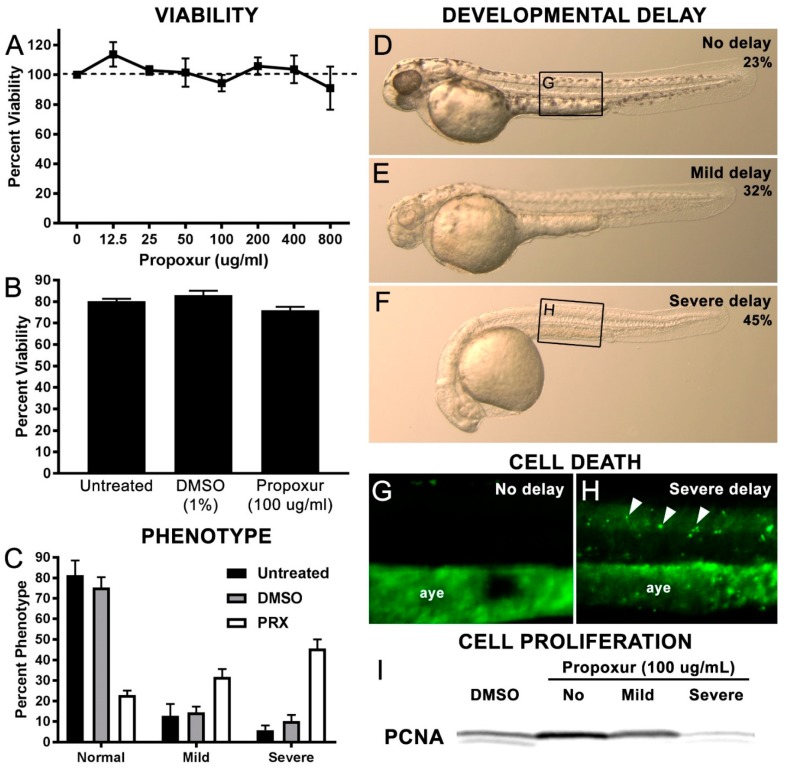
Propoxur exposure during zebrafish development results in three distinct developmental delay phenotypes: (A) Percent viability of treated embryos at varying propoxur concentrations; (B) percent viability of embryos in untreated, 1% DMSO-treated, and 100 ug/mL propoxur-treated groups; (C) percent of delay phenotypes present in untreated, DMSO-treated, or propoxur-treated groups; visual representation of phenotypic groups at 40 hpf: (D) no delay, (E) mild delay, and (F) severe delay. (G,H) Acridine orange uptake shows an increase in fluorescent puncta (arrowheads) associated with the severe delay group compared with the no delay group. These puncta are distinct from the autofluorescence observed in the anal yolk extension (aye) in both groups. The panel insets for Figure 1G,H are shown in Figure 1D,F, respectively; (I) Western blot analysis of the G1/S protein Proliferating Cell Nuclear Antigen (PCNA) shows reduced PCNA expression in the severe delay groups, suggestive of reduced cell proliferation.

