Figure 3.
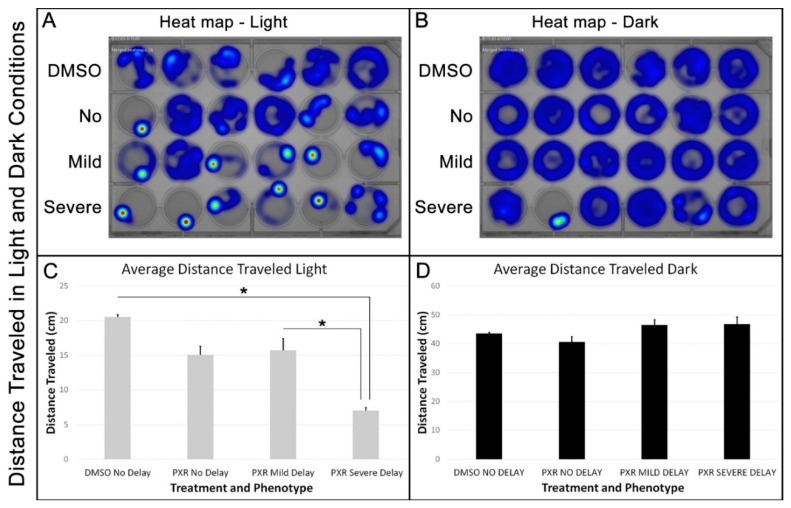
Zebrafish severely delayed by propoxur treatment showed greater aversion to light with less movement at 7 days postfertilization: (A) Heat map representation of the concentration of movement for each group during a single light interval; (B) heat map representation of the concentration of movement for each group during a single dark interval; (C) graphical representation of the average distance traveled for each group during the cumulative light intervals. The asterisks indicate a significant difference between the groups; and (D) graphical representation of the average distance traveled for each group during the cumulative light intervals.

