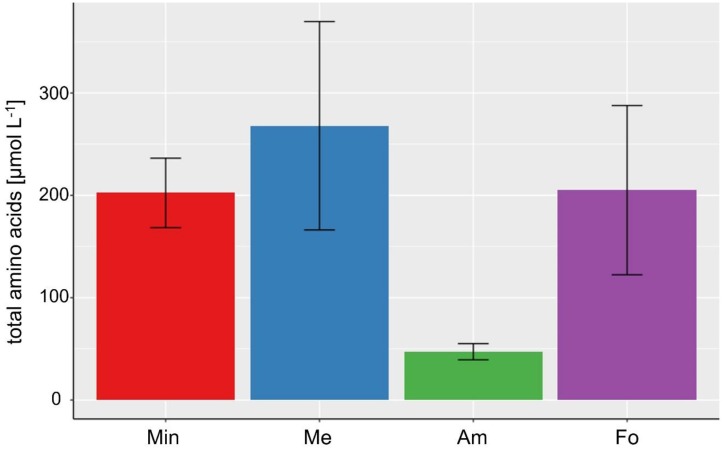
Figure 4.
Bar chart of the mean value of the total amino acid concentrations in µmol L−1 for the four different experimental settings “Min” (all amounts at minimum), “Me” (high CH3OH), “Am” (high in NH4Cl), and “Fo” (high in H2CO) (n = 4 each, error bars present respective standard deviations). As also seen in the statistical analysis, a high concentration of NH4Cl seems to inhibit the amino acid production most strongly.

