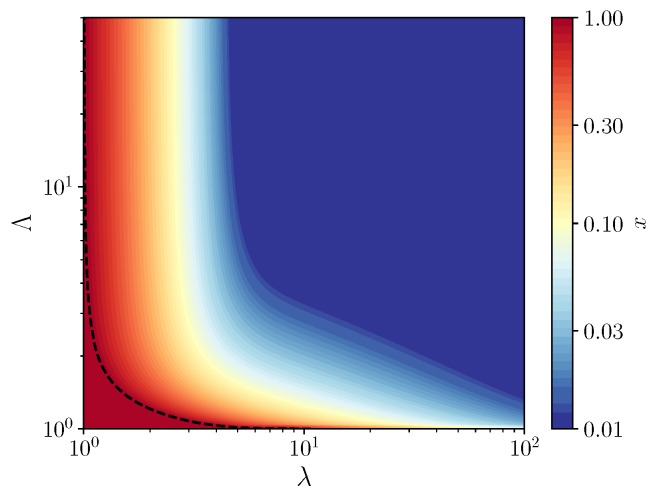
Figure 2.
Contour map of the fraction x of replicators as a function of , for a carrying capacity , where denotes the average number of molecules per compartment and the relative growth rates of the parasites with respect to the host. The dotted line is the contour of , which marks the border of the pure replicators phase (the red region). Above this line, a coexistence region exists between the two species at a fraction of replicators indicated by the color scale.

