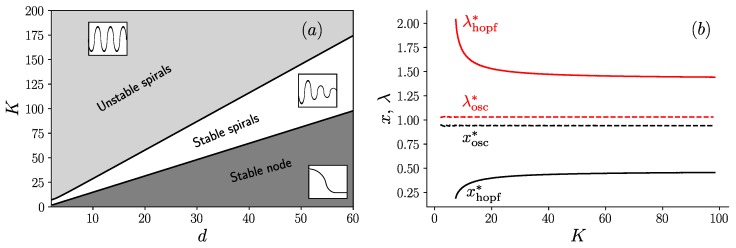
Figure 5.
(a) Phase diagram in the plane (K, d) in the limit containing three regions: unstable spirals (with an inset representing steady oscillations), stable spirals (with an inset representing damped oscillations) and stable node (with an inset representing a curve with no oscillations); and (b) evolution of the fixed point coordinates (, ) as a function of K, on the Hopf bifurcation (solid line) and on the transition line between the stable node and stable spirals (dashed line).

