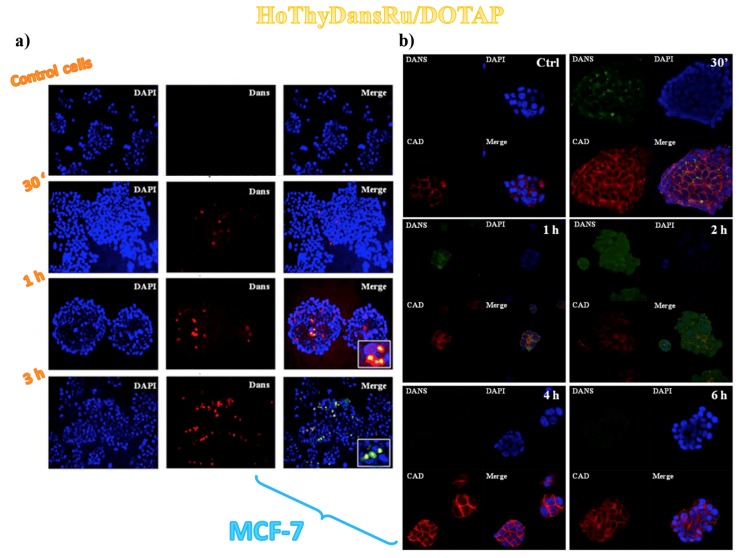
Figure 8.
Human MCF-7 breast adenocarcinoma cells incubated with 100 µM HoThyDansRu/DOTAP liposome formulations and followed at different times: (a) fluorescent photomicrographs of cell monolayers showing the cellular localization of the fluorescent HoThyDansRu/DOTAP liposomes; (b) confocal microscopy bioimaging showing the cellular uptake of the fluorescent HoThyDansRu/DOTAP nanosystem. DAPI was used as a nuclear stain (shown in blue). Dansyl-dependent fluorescence (Dans) of HoThyDansRu/DOTAP liposomes is shown in red (a) or as green dots (b). E-cadherine-associated fluorescence (CAD), defining cell shape, is shown in red (b). In merged images (Merge), the two fluorescent emission patterns are overlapped. Insets in panel a represent higher magnifications of merged images showing cellular location of fluorescent dansylated ruthenium complexes. Figures were adapted with permission from [106] Copyright (2013) American Chemical Society (a) and from [100] (b).

