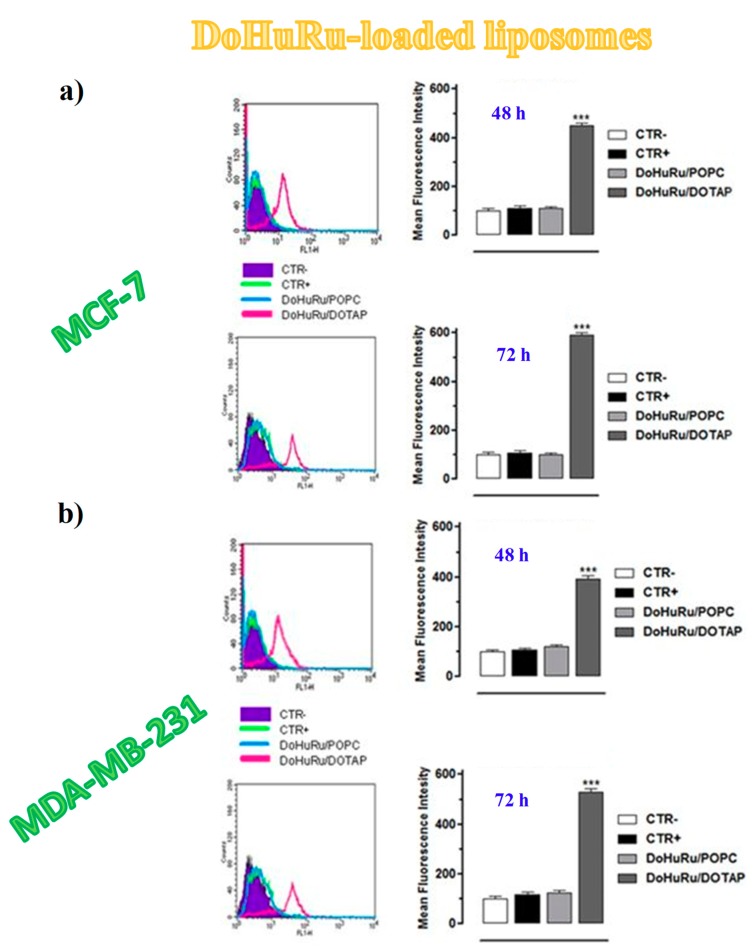
Figure 14.
Quantitative flow cytometric analysis of autophagosomes formation (MDC incorporation) in MCF-7 (a) and MDA-MD-231(b) breast cancer cells for the autophagy activation evaluation: unlabelled and untreated (CTR −), labelled and untreated (CTR +), treated with IC50 concentrations of DoHuRu/POPC or with DoHuRu/DOTAP formulations for 48 and 72 h, as indicated. In the bar graphs, calculated main fluorescence intensities (MFIs) values are expressed as percentage of control cells. Figures are adapted from [134].

