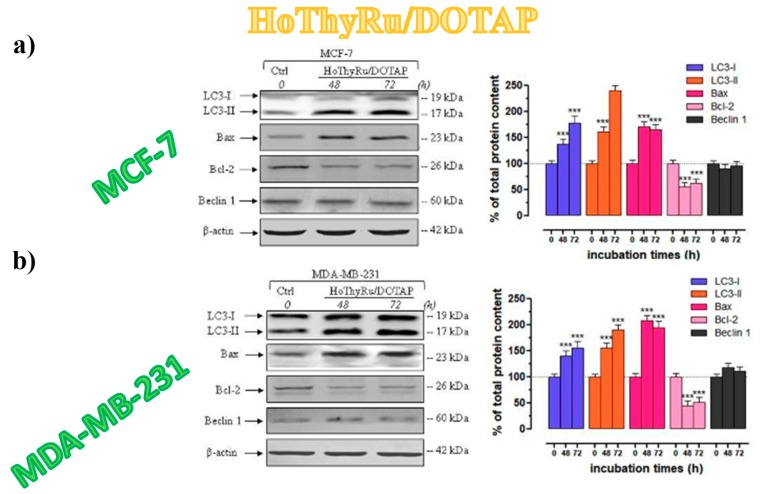
Figure 15.
Western blot analysis showing the effects of IC50 doses of HoThyRu/DOTAP liposomes following 48 and 72 h of incubation in MCF-7 (a) and MDA-MB-231 cells (b) on LC3-I, LC3-II, Bax, BCL-2, and Becli-1 expression (Ctrl, untreated cells at the time zero). Bands resulting from MCF-7 and MDA-MB-231 cells were extracted, quantified by densitometric analysis and then plotted in bar graphs (right of each panel) as percentage of controls. Figures are adapted from [100].

