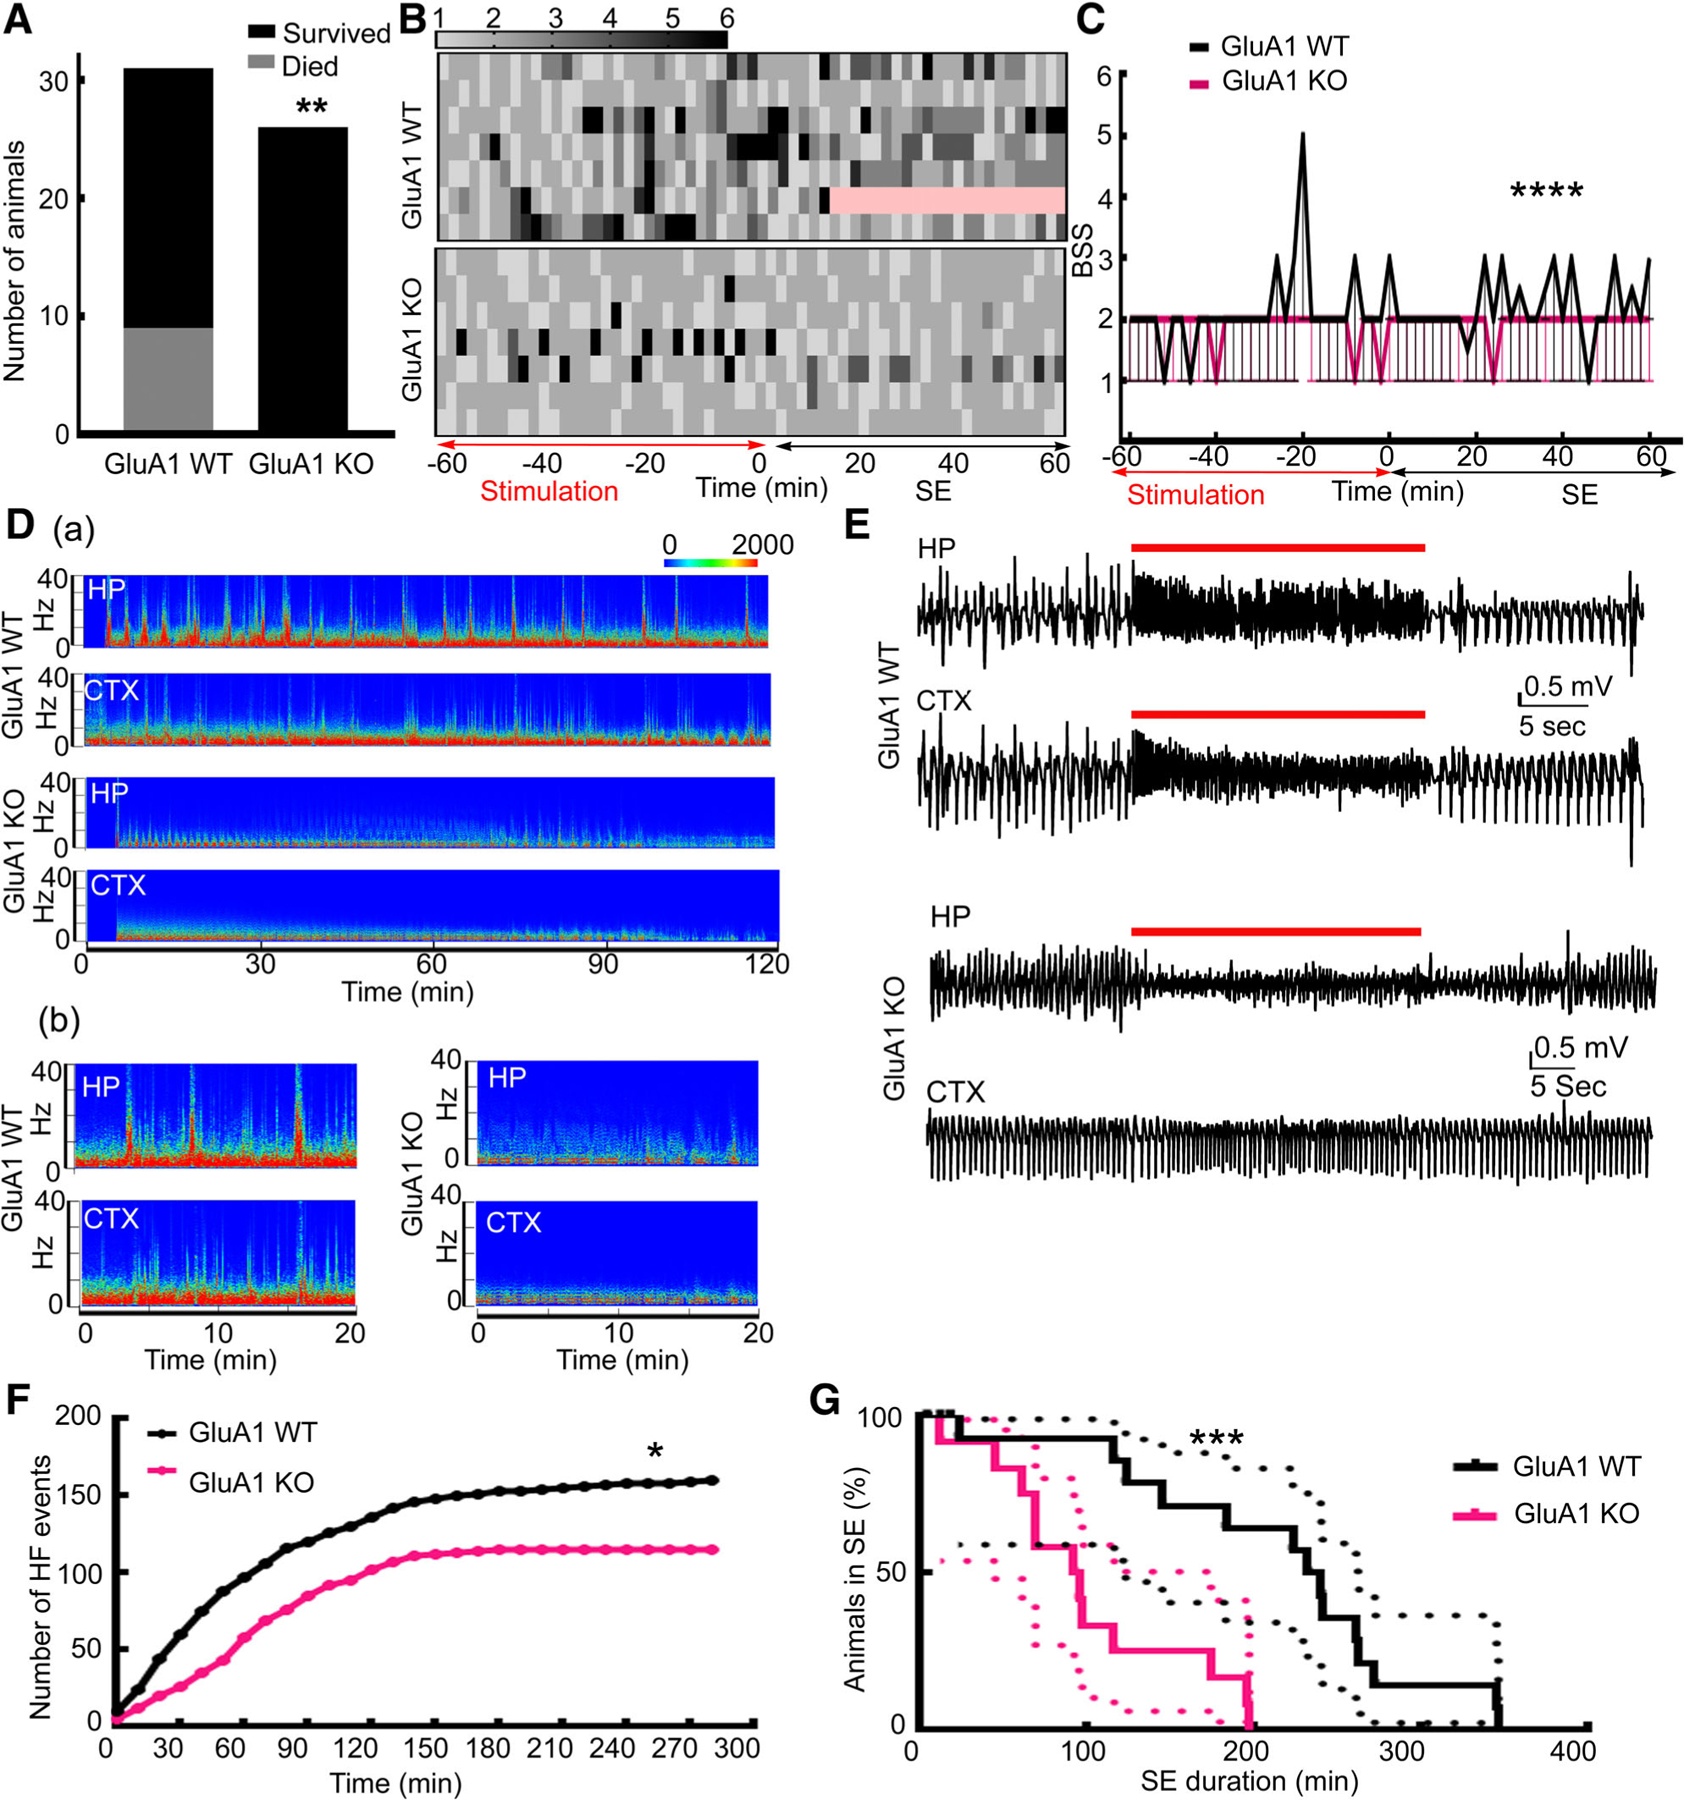
FIGURE 1:

Status epilepticus (SE) was not fatal, was less intense, and had shorter duration in GluA1 knockout (KO) mice. (A) Survival during SE. All 26 GluA1-KO animals survived SE; 9 GluA1 wild-type (WT) animals died during SE, and 22 survived (**p = 0.0022, 1-sided Fisher exact test). (B) Heat maps illustrating the severity of behavior seizure scores in GluA1-WT and GluA1-KO animals during SE. Death is marked in pink. Rows signify individual animals, and 7 animals were randomly chosen to represent each group. The seizures were scored every alternate minute during stimulation and for the first hour of the self-sustained SE seizures. The red and black arrows mark the end of stimulation and the first hour of self-sustaining SE. (C) The median behavioral seizure scores (BSSs) along with 95% CI in the GluA1-WT and GluA1-KO animals illustrated in B, n = 7 each; ****p < 0.0001, 2-tailed Mann–Whitney test. (D, a) Spectrograms illustrating the power of electroencephalograms (EEGs) recorded from the hippocampus (HP) and cortex (CTX) during the initial 120 minutes of the self-sustaining phase of SE from a representative GluA1-WT and GluA1-KO animal. The scale bar represents power in square microvolts. Please note that SE duration was shorter in the GluA1-KO animal, and there was a substantial reduction in the power of EEG by 120 minutes. (D, b) A part of the spectrogram is magnified to illustrate the high-frequency spike-wave discharges marked by streaks of elevated power prominent in the GluA1-WT animal but not in the GluA1-KO animal. These events were generally associated with severe behavioral seizures (4–6). (E) Hippocampal and cortical EEGs illustrating a representative high-frequency spike-wave discharge, marked by red lines, in the GluA1-WT animal. Please note that in the GluA1-KO animals, the amplitude of discharges was reduced in the hippocampal recording during an event, and the event was not prominent in cortical EEGs. (F) The cumulative frequency distribution of the high-frequency (HF) spike-wave discharges in 12 randomly selected GluA1-WT and GluA1-KO animals. The data were binned every 10 minutes. *Approximate p = 0.027, Kolmogorov–Smirnov test. (G) Kaplan–Meier survival curves illustrating the duration of SE, which occurred earlier in the GluA1-KO animals than in GluA1-WT animals, n = 17 GluA1-WT and n = 12 GluA1-KO; *** p = 0.0006 Gehan–Breslow–Wilcoxon test.
