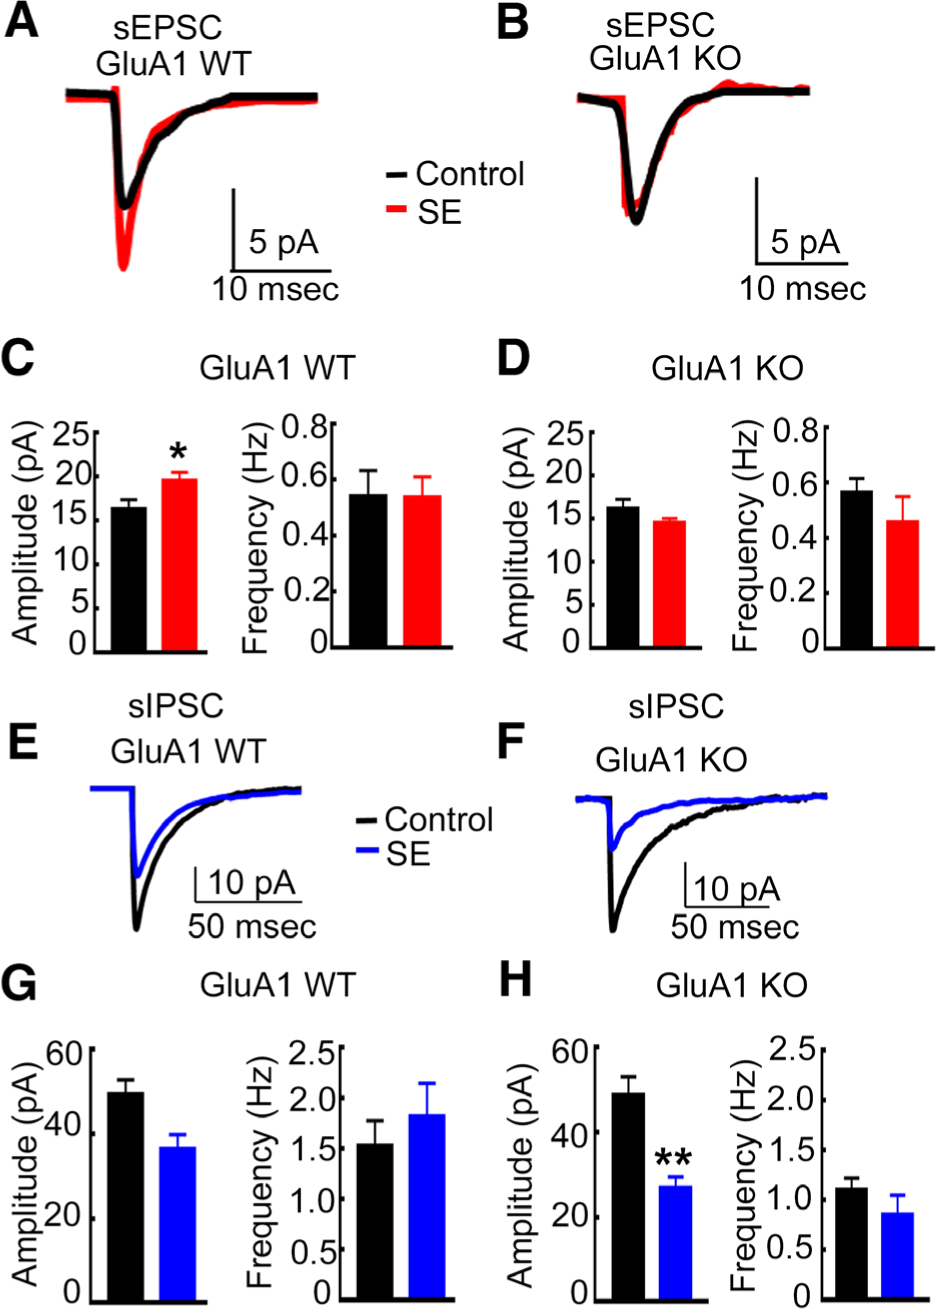
FIGURE 3:

The enhancement of α-amino-3-hydroxy-5-methyl-4-isoxazolepropionic acid receptor–mediated synaptic transmission during status epilepticus (SE) was blocked, but the diminution in γ-aminobutyric acid receptor–mediated synaptic inhibition during SE occurred in GluA1 knockout (KO) animals. (A) Averaged spontaneous excitatory postsynaptic current (sEPSC) traces recorded from CA1 pyramidal neurons of a representative control GluA1 wild-type (WT) animal (black) and a WT animal in SE (red). (B) Averaged sEPSC traces from a control GluA1-KO animal and in a KO animal in SE. (C) The mean of the median amplitude and the average frequency of sEPSCs recorded from control and SE WT animals. The amplitude in WT controls was 16.4 ± 1.0pA (n = 8 cells, n = 4 animals), and that in WT SE animals was 19.7 ± 0.9pA (n = 8 cells, 5 animals; *p = 0.028, unpaired t test). The frequency in control WT animals was 0.54 ± 0.9Hz, and that in WT SE animals was 0.54 ± 0.07Hz (n is the same as for amplitude measurements; p = 0.98, unpaired t test). (D) The mean of the median amplitude and the average frequency of sEPSCs recorded from control and SE KO animals. The amplitude in KO control and KO SE animals was 16.2 ± 1.0pA (5 cells from 3 animals) and 14.6 ± 0.43pA (8 cells from 5 animals), respectively (p = 0.132, unpaired t test). The frequency in control and SE animals was 0.57 ± 0.05Hz and 0.46 ± 0.09Hz, respectively (n is the same as for amplitude measurements; p = 0.4, unpaired t test). (E) Averaged spontaneous inhibitory postsynaptic current (sIPSC) recorded from the CA1 pyramidal neurons of a control GluA1-WT animal (black) and a WT animal in SE (blue). (F) Averaged sIPSCs recorded from CA1 pyramidal neurons of control and SE GluA1-KO animals. (F) Mean of the median sIPSC amplitude in WT control (49.5 ± 3.3pA, 8 cells from 5 animals) and WT SE animals (36.6 ± 3.3pA, 7 cells from 5 animals; p = 0.017, unpaired t test) and the mean frequency of events in the control and SE animals (1.5 ± 0.25Hz and 1.8 0.33Hz, respectively; p = 0.49, unpaired t test). (G) The mean of the median amplitude and the mean frequency of sIPSCs recorded from GluA1-KO control and SE animals. (H) The mean sIPSC amplitude in the control and SE animals was 48.9 ± 4.3pA (8 cells from 5 animals) and 26.9 ± 2.7pA (6 cells from 5 animals), respectively (**p = 0.0018, unpaired t test). Mean sIPSC frequency in control and SE animals was 1.1 ± 0.12Hz and 0.86 ± 0.19Hz, respectively (p = 0.27, unpaired t test).
