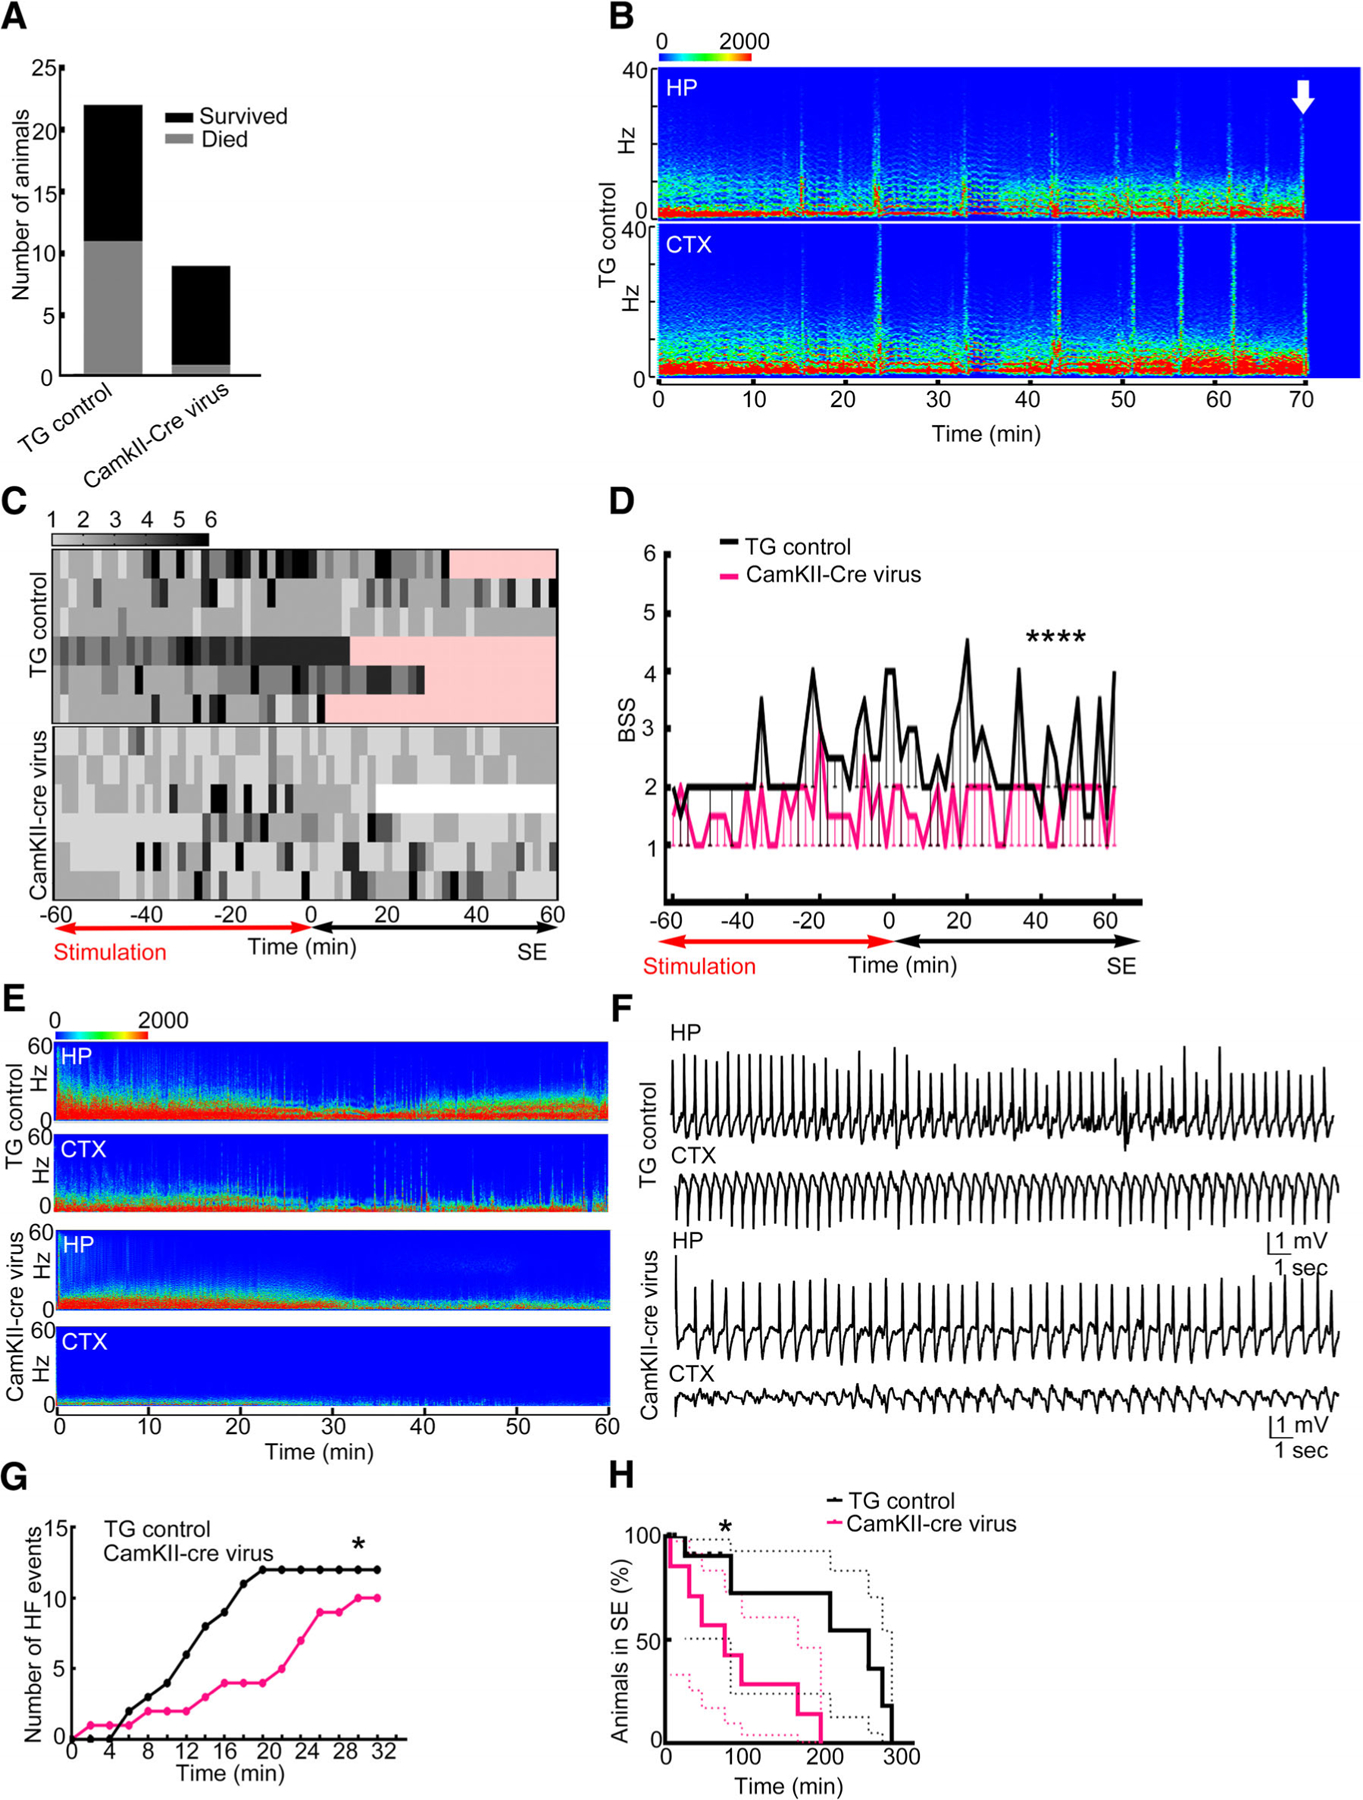
FIGURE 5:

Conditional deletion of the GluA1 subunit using adeno-associated virus (AAV)-expressing green fluorescent protein (GFP)-tagged CamKII-Cre was protective. (A) A comparison of floxed GluA1 animals injected with AAV9-expressing CamKII-GFP (transgenic [TG] control control) and CamKII-Cre-GFP (CamKII-Cre) that died during status epilepticus (SE); death occurred in 11 of the 22 TG control animals and in 1 of the 9 CamKII-Cre virus animals (p = 0.0496, 1-sided Fisher exact test). (B) The electroencephalographic (EEG) power spectrum shows death in an animal marked by an arrow. High-frequency discharge immediately preceded death. CTX = cortex; HP = hippocampus. (C) Heat maps illustrating behavioral seizure scores in the TG control and CamKII-Cre virus–injected floxed GluA1 animals. Each row represents 1 animal; 7 animals were randomly scored in each group. The time subsequent to the death of the animal is marked in pink and after the end of SE is marked in white. (D) Median and 95% confidence interval of the behavioral seizure score (BSS) in the animals illustrated in A (****p < 0.0001, 2-tailed Mann–Whitney test). (E) Spectrogram illustrating the power of EEGs recorded from the hippocampus and cortex during the first hour of SE from a TG control and CamKII-Cre virus–injected animal. (F) Hippocampal and cortical EEGs during SE from a TG control and a CamKII-Cre virus–injected animal. (G) Cumulative frequency distribution of high-frequency spike-wave discharges recorded from 7 representative TG control and CamKII-Cre virus–injected animals. The data are binned every 10 minutes (*p = 0.0207, Kolmogorov–Smirnov test). (H) A Kaplan–Meyer curve illustrating duration of SE in TG control (n = 14) and CamKII-Cre virus–injected (n = 7) animals (*p = 0.0405 Gehan–Breslow–Wilcoxon test).
