Fig. 10.

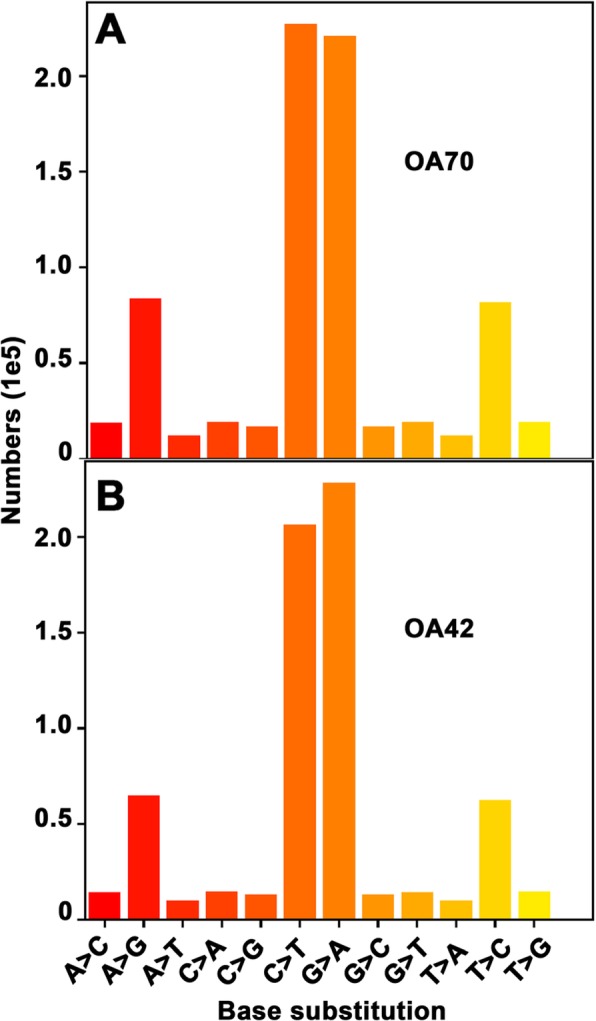
Characterization of EMS induced SNPs. The number of base substitution is shown for the mutagenized lines OA70 (a) and OA42 (b). The highest rate of base substitutions was observed for C to T and G to A

Characterization of EMS induced SNPs. The number of base substitution is shown for the mutagenized lines OA70 (a) and OA42 (b). The highest rate of base substitutions was observed for C to T and G to A