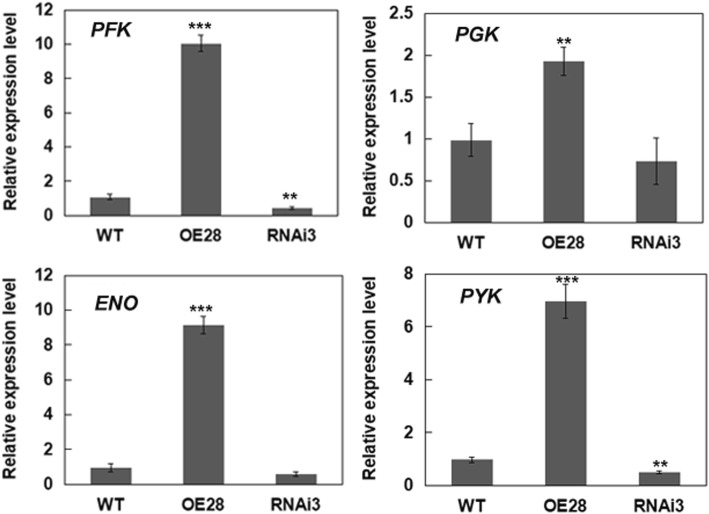
Fig. 7.
Expression of representative glycolytic genes in developing seeds of the transgenic canola plants. qRT-PCR was performed using total RNA prepared from developing seeds (40 DAP) collected from the WT and transgenic plants. The expression levels were quantified relative to the value obtained from WT plants. Error bars represent SD (n = 3). The significant differences between transgenic lines and WT are indicated (Student’s t-test): ***, P < 0.001; **, P < 0.01; *, P < 0.05

