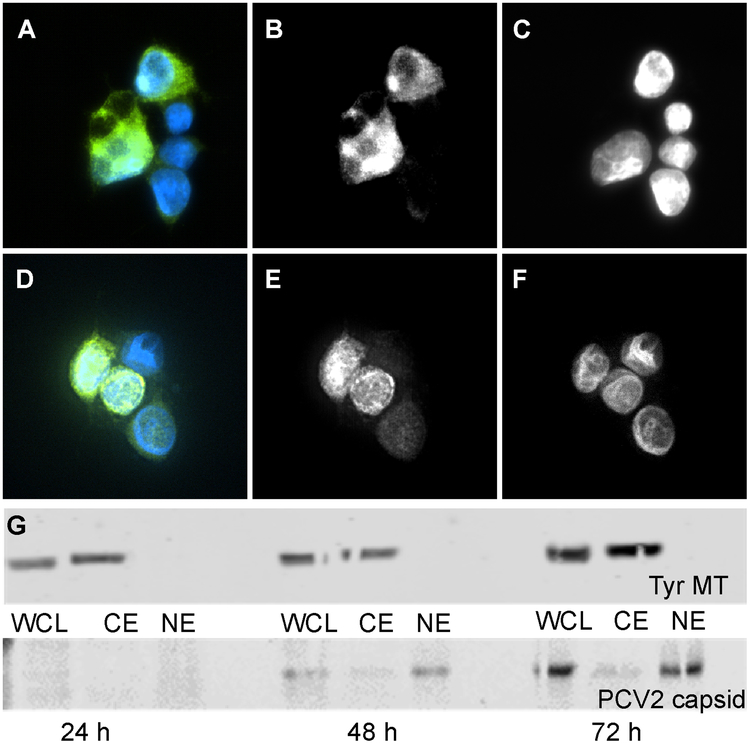
Figure 2. Location of expressed PCV2d capsid protein in transfected HEK293 cell.
Transfected cells were fixed with acetone and labeled with mouse anti-PCV2 capsid monoclonal antibody to probe the capsid (green) and with DAPI (blue) to localize the nuclei. A) images from cells 48 hours post transfection with immunofluorescence from the capsid shown by the green channel and fluorescence from DAPI (nucleus labeling) by the blue channel. B) same image showing information from the green channel (capsid), C) same image showing information from the blue channel labeling (nucleus). D) images from cells 72 hours post transfection with immunofluorescence identical to A). E) same image showing information from the green channel (capsid), F) same image showing information from the blue channel (nucleus). G) Western blot analysis of whole cell lysate (WCL), cytoplasm (CE) and nuclear extracts (NE) collected 24, 48 and 72 hours post transfection. Top panel) The samples were probed for tyrosinated microtubules. Bottom panel) The samples were probed for PCV2 CP. The presence of tyrosinated microtubules in CE but not in NE provided the quality control of cell fractionation.

