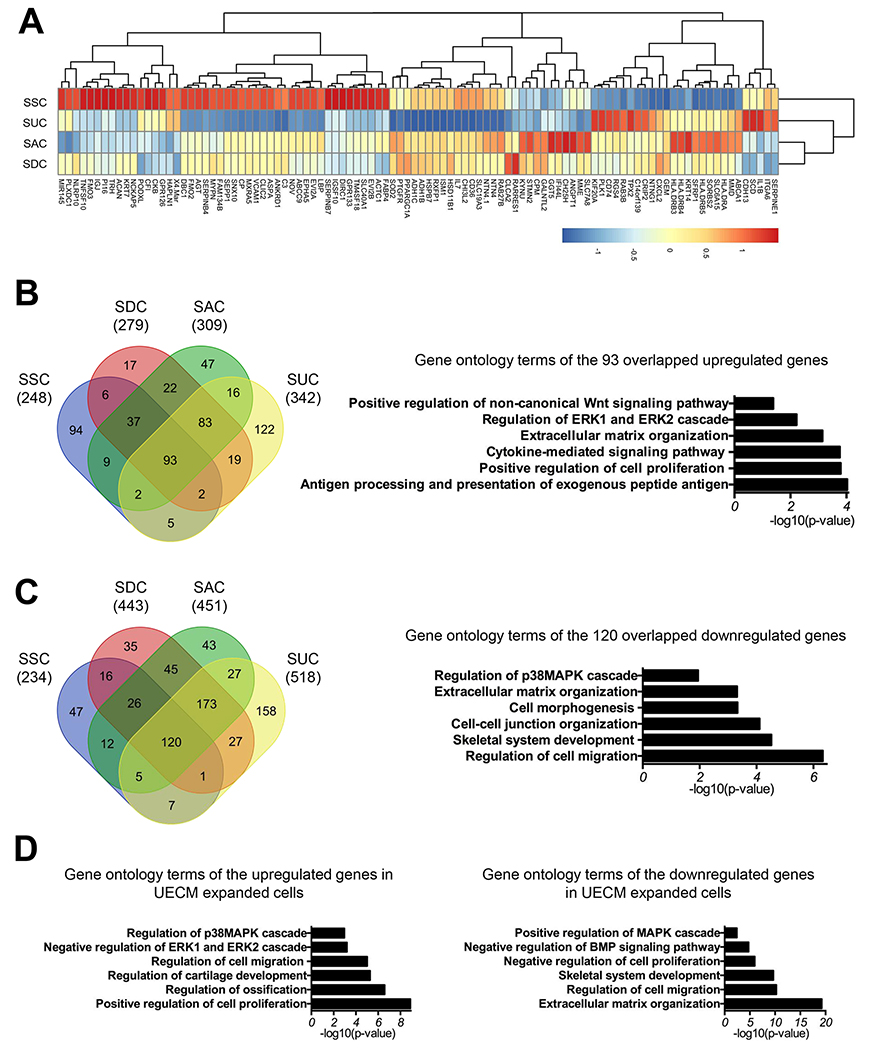
Fig. 6.
Gene expression profile of SDSCs expanded on dECMs by microarray analysis. A heatmap showing relative expression patterns of the top 100 differentially expressed genes changed in SSC (A). Venn diagram of upregulated (B) or downregulated (C) genes in all dECM expanded cells compared to plastic substrate expanded cells which were then compared to each other, followed by gene ontology analysis of the overlapping 93 upregulated (B) or 120 downregulated (C) genes among all groups. Gene ontology analysis was also performed for the upregulated and downregulated genes in UE expanded cells (SUC) (D).

