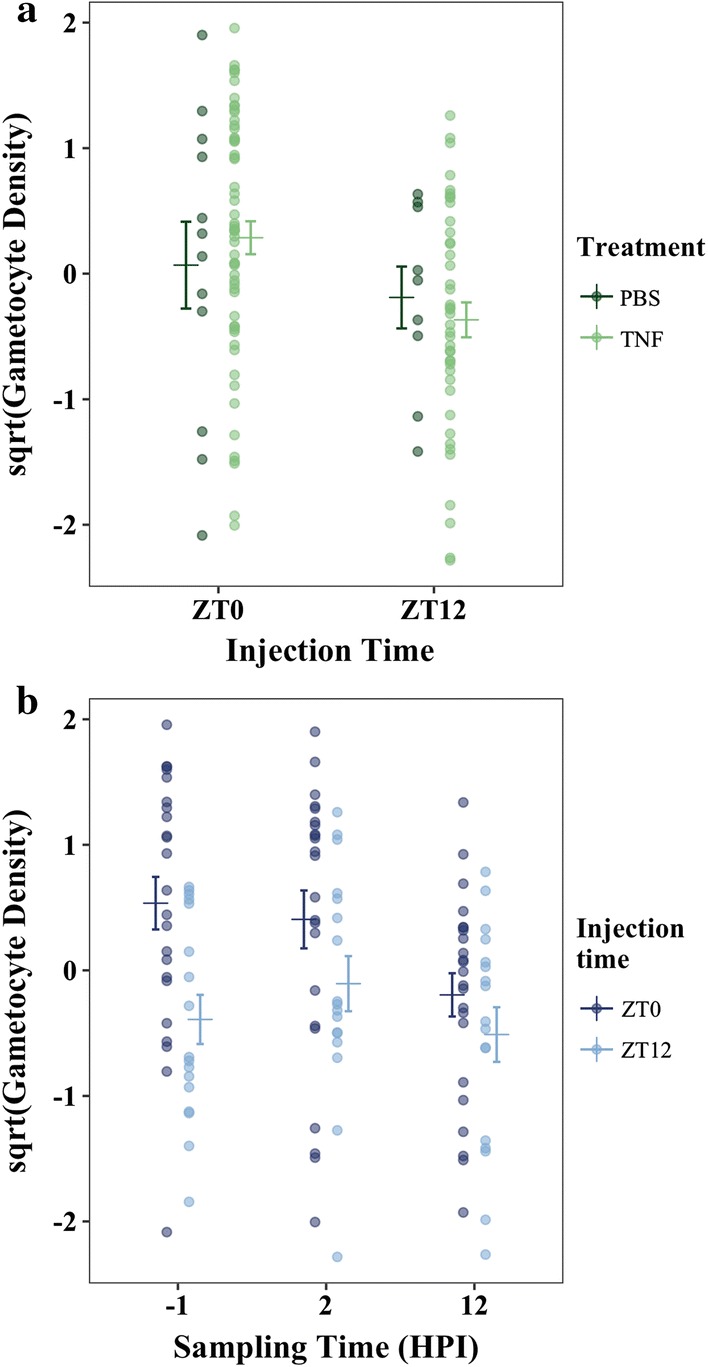
Fig. 4.

a Cumulative gametocyte density (gametocytes/mL blood) for all sampling timepoints, alongside mean ± SE (calculated post-transformation), in mice injected with either TNF or carrier at either ZT0 or ZT12. b Gametocyte density (gametocytes/mL blood), alongside mean ± SE, for combined treatment groups (TNF and control) in mice injected at either ZT0 or ZT12 for each sampling time (− 1 (baseline), 2-, and 12 HPI). In both plots, points represent raw data, square-root-transformed to approximate normality, and scaled to have a mean of 0 and a standard deviation of 1
