Figure 4.

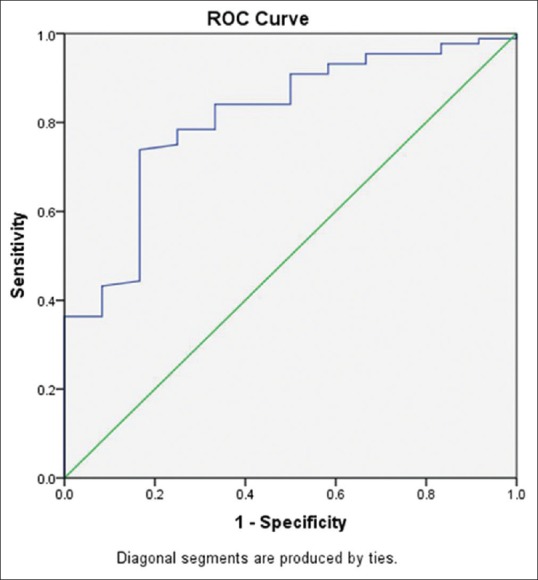
Receiver operating characteristic (ROC) curve obtained with the help of statistical analysis software SPSS. The area under the curve (AUC) is 0.811 at 95% CI and P < 0.05

Receiver operating characteristic (ROC) curve obtained with the help of statistical analysis software SPSS. The area under the curve (AUC) is 0.811 at 95% CI and P < 0.05