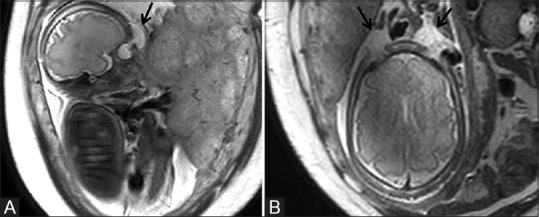
Figure 2 (A and B).

Sagittal T2-weighted image (A) of the fetus showing hyperintense cystic swelling in supraorbital location (arrow). Axial image (B) showing the cystic swelling on both sides (arrows)

Sagittal T2-weighted image (A) of the fetus showing hyperintense cystic swelling in supraorbital location (arrow). Axial image (B) showing the cystic swelling on both sides (arrows)