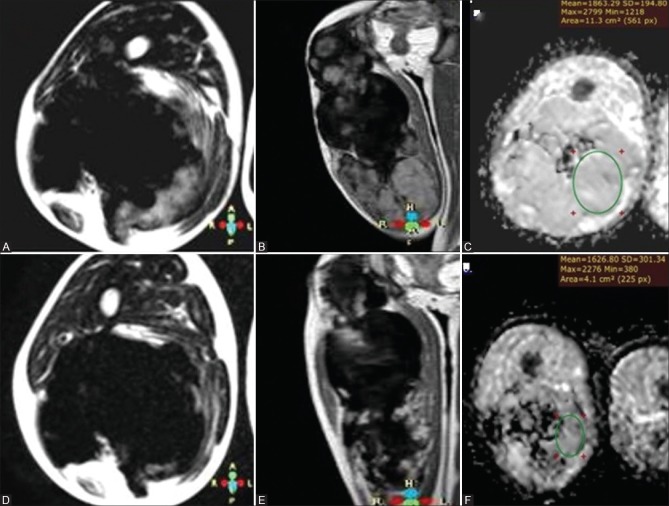
Figure 5 (A-F).
A 8-year-old patient with fibromatosis on chemotherapy with prechemotherapy series (A) axial T2WI (B) postcontrast coronal T1 WI and (C) ADC map and postchemotherapy series (D) axial T2WI (E) postcontrast coronal T1 WI and (F) ADC map showing overall decrease of the high T2 WI signal with predominance of the low T2 signal, marked decrease in the degree of postcontrast enhancement in the posttherapeutic images, as well as decrease of mean and minimum ADC values, previously reading 1.86 × 10⁻³ mm2/s and 1.21 × 10⁻³ mm2/s being 1.63 × 10⁻³ mm2/s and 0.38 × 10⁻³ mm2/s in posttherapeutic series

