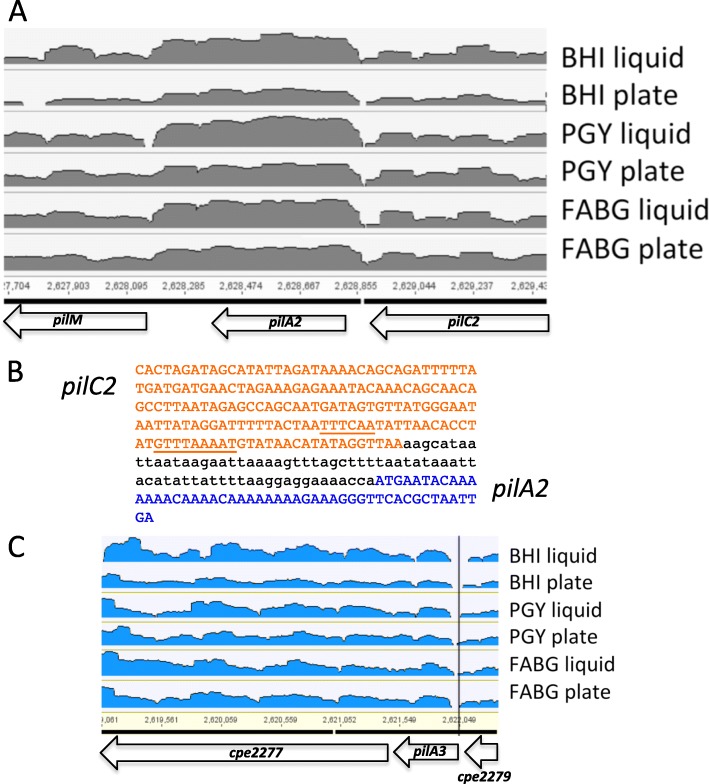
Fig. 6.
a Depth of coverage (volcano) plot (log scale) showing the transcript levels covering the pilA2 gene for cells grown under the indicated conditions. b The location of a putative promoter for pilA2 (underline) located in the 3′ end of the pilC2 gene. The coding region for pilC2 is shown in red, the coding region for pilA2 in blue. c Location of a gap in transcripts between the gene encoding CPE2279 and pilA3 genes (vertical black line)

