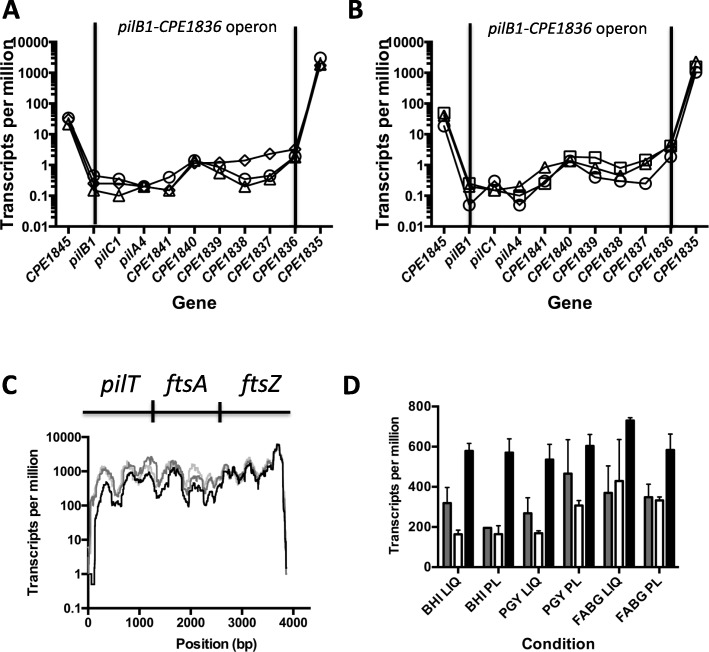
Fig. 7.
a and b) Transcript levels of genes in the pilB1- the gene encoding CPE1836 operon in cells grown on plates (a) and in liquid (b). Circles, BHI; triangles, PGY; squares, FABG. The vertical bars represent the boundaries of the proposed operon. Note the higher levels of transcripts seen in the flanking genes. Data points were connected by lines to illustrate trends in changes of transcript levels. c Base by base transcript levels of the pilT-ftsA-ftsZ operon from cells grown on plates. Black line, BHI; dark gray line, PGY, light gray line, FABG. A similar pattern was observed for cells grown in each medium in liquid. d Transcript levels for each gene in the pilT-ftsA-ftsZ operon under the conditions indicated on the X-axis. Gray, pilT; white, ftsA; black, ftsZ. PL, plates; LI, liquid. The mean and SEM are shown

