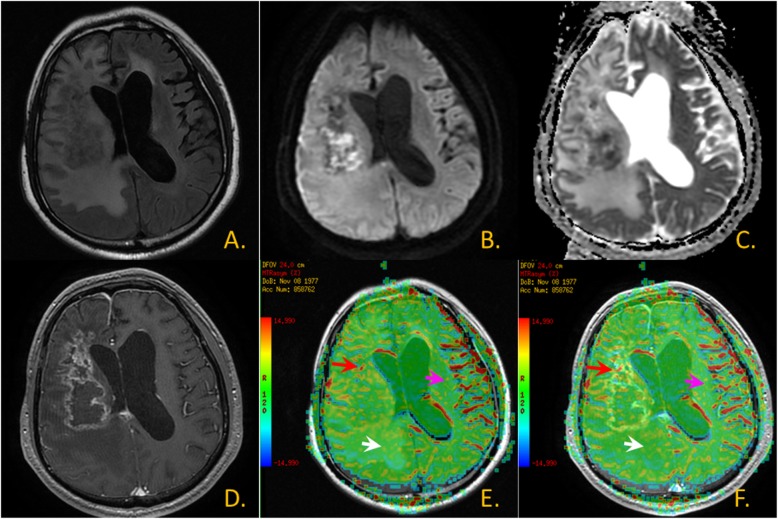
Fig. 3.
Glioma images. a. T2 FLAIR image; b. DWI; c. ADC map; d. T1WI + C; e. CEST MTR map and T2 FLAIR image fusion: The red arrow area is shown as lesion-parenchymal areas, The white arrow area is shown as edema areas and The pink arrow area is shown as non-focus areas; f. CEST MTR map and T1WI + C fusion: The red arrow area is shown as lesion-parenchymal areas, The white arrow area is shown as edema areas and The pink arrow area is shown as non-focus areas

