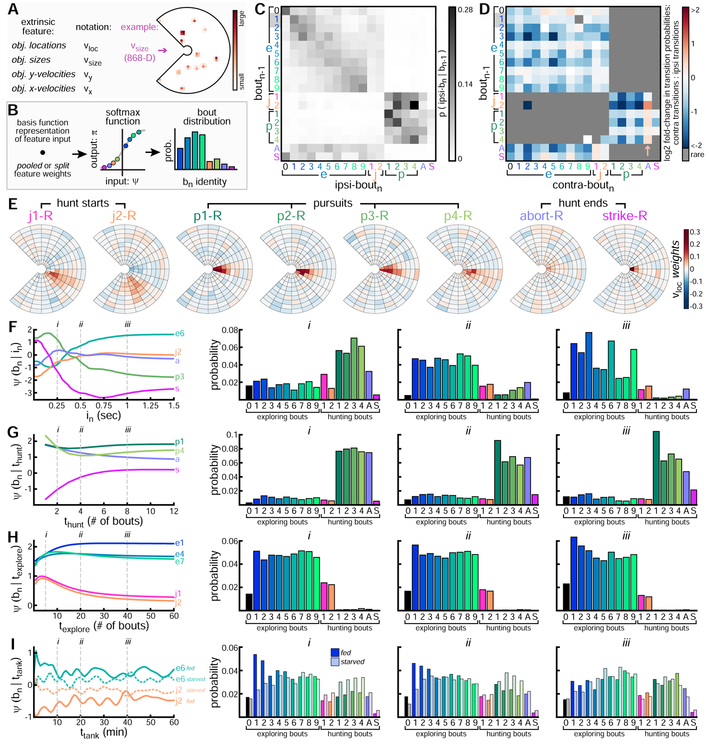
Figure 5: Probabilistic Models to Predict Bout-Types.
A. Extrinsic features encode surface object locations and properties (see Figure S4). For example, νsize encodes object sizes (here, for objects from Figure 1K). B. Schematic of GFM to generate predictive probability distribution over bn. C. Ipsilateral bout transition probabilities (i.e. left to left, or right to right) from pooled-bn–1 model. Each row shows bn probability given preceding boat-type. D. Contralateral bout transition probabilities (i.e. left to right, or right to left) from pooled-bn–1 model, reported relative to ipsilateral transition probabilities. Rare transitions not shown. Blue squares indicate transitions that are more likely to occur ipsilaterally. Transitions into abort are more likely to occur contralaterally. E. Weights from pooled-νloc model shown for each rightward hunting bout-type. F. pooled-in model summary. Activations of 5 bout-types shown given preceding interbont interval. Full bout-type probability distribution evaluated at 3 specific in values (indicated with i, ii, iii). G-I. Similar to F, but for hunt dwell-time, explore dwell-time, and tank-time. We choose the split architecture for tank-time, with separate distributions for fed and starved fish shown.

