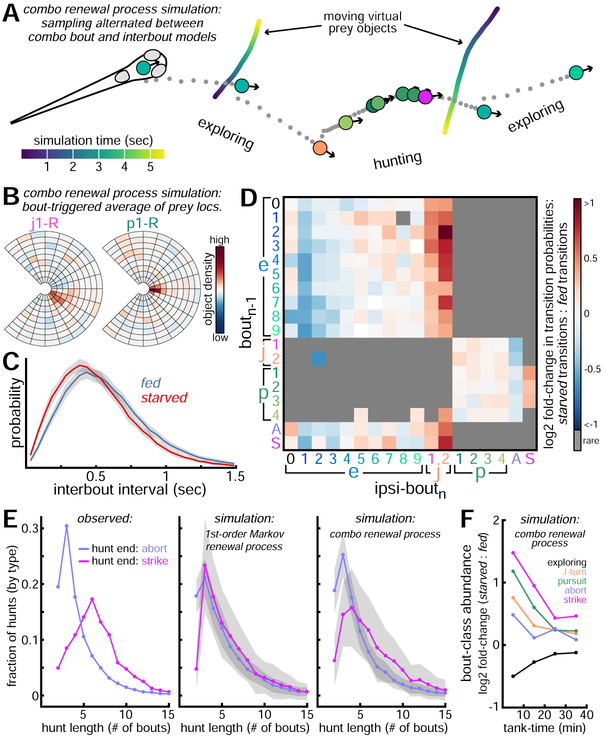
Figure 7: Simulating Trajectories of Fed and Starved Fish.
A. We simulate behavioral trajectories of 50 fed and 50 starved fish (40 minutes per fish) by alternating sampling from combo interbout and bout models (here called a combo renewal process). ~5 seconds of simulated behavior shown in which fish hunts and strikes at a virtual prey. See Video S3 for animation of this simulated sequence and Video S4 for visualization of how these bout-types and intervals were selected from conditional probability distributions evolving overtime. Fish move through the environment using bout-type trajectories shown in Figure S7. Virtual prey move through environment as biased random-walking particles with fixed sizes and speeds. B. Bout-type triggered averages of fish FOV preceding initiation of 2 bout-types. C. Histograms of simulated interval durations (mean ± SE). D. Ipsilateral bout transition probabilities of simulated fed and starved fish are compared. Red squares indicate increased transition probability for starved fish relative to fed fish. E. Hunt length distributions for complete hunts ending in strike or abort. Left panel: real data. Middle panel: data from simulations in which bout-types and intervals depend on only preceding bout-type (called a 1st-order Markov renewal process). Right panel: data from combo renewal process simulations. F. Relative bout-class abundances produced in combo renewal process simulations (similar to Figure 3E).

