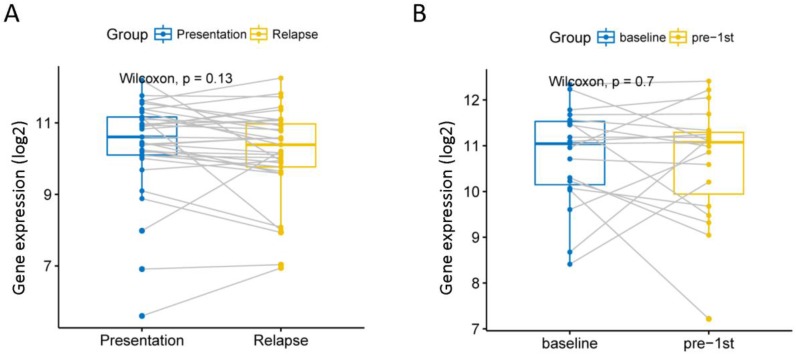
Figure 5.
We analyzed the relationship between EPB41L4A expression before and after relapse or treatment. Gray lines are connected to samples from the same patient. A, Compare the expression levels of EPB41L4A before and after recurrence in the same patient. 33 MM patients from dataset GSE82307; P = 0.13, wilcoxon text. B, Compare the expression levels of EPB41L4A between untreated and after pre-1st chemotherapy in the same patient. 19 MM patients from dataset GSE19554; P = 0.7, wilcoxon text.

