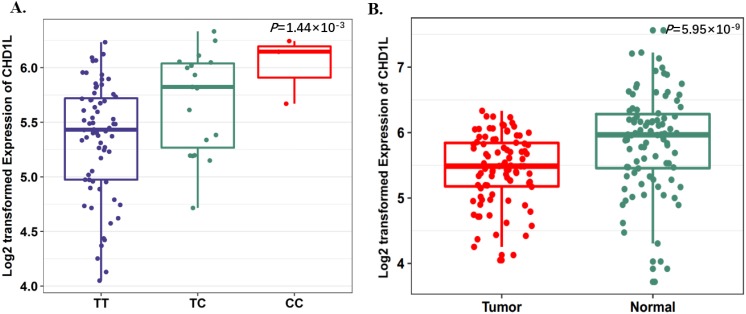
Fig 1.
SNP rs17160062 as a possible eQTL for CHD1L. A, The boxplot shows the associations between genotypes of rs17160062 and CHD1L expression in 90 normal lung tissue from our previous study. The P-value was derived from linear regression analysis. B, The boxplot shows the expression level of CHD1L was increased in 90 tumor tissues compared with paired adjacent samples. The P-value was derived from Wilcoxon rank sum tests. Expression of CHD1L were log2 transformed. The boxplot displays the first and third quartiles (top and bottom of the boxes), the median (band inside the boxes), and the lowest and highest point within 1.5 times the interquartile range of the lower and higher quartiles (whiskers).

