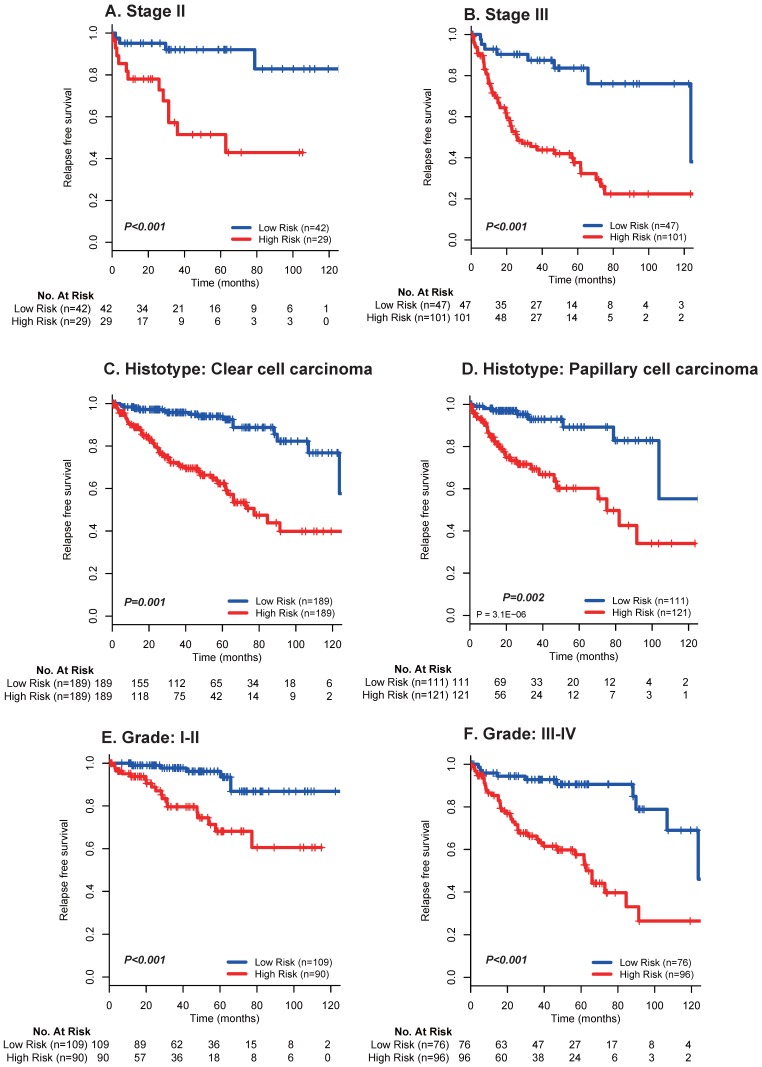
Figure 3.
Kaplan-Meier survival analysis for the entire set with stage I-III renal cell cancer (N = 610) from TCGA data based on the 17-mRNA-based signature stratified by stage II (A), stage III (B), clear cell carcinoma (C), papillary cell carcinoma (D), Grade I-II (E) and Grade III-IV (F). TCGA: The Cancer Genome Atlas (TCGA) dataset.

