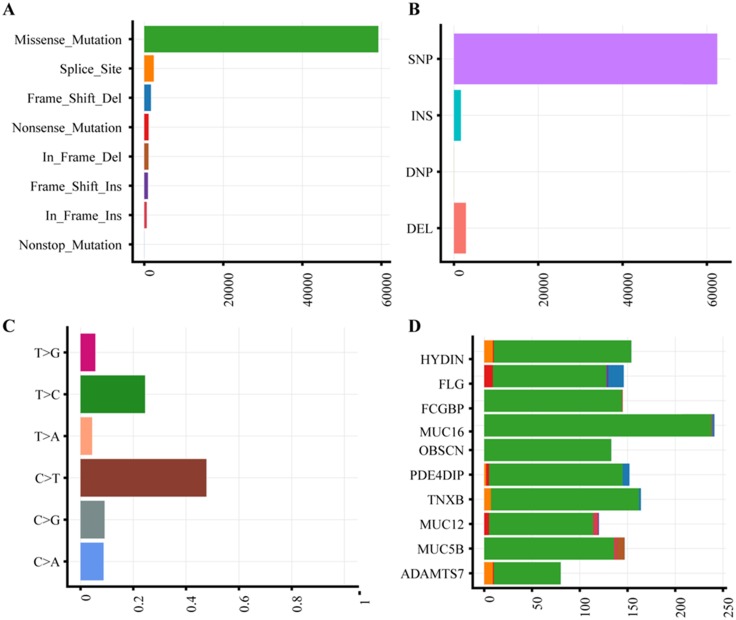
Figure 1.
Mutation plot summary of colorectal cancer samples. (A) Variant classification. X axis indicated variant numbers. Y axis represented different variant classification. (B) Variant type. X axis indicated variant numbers. Y axis represented different variant type. (C) SNVs type. X axis indicated the ratio. Y axis represented the type of nucleotide substitution. (D) Top10 mutated genes. X axis indicated variant numbers. Y axis represented different genes. The genes were ordered by their mutation frequency.

